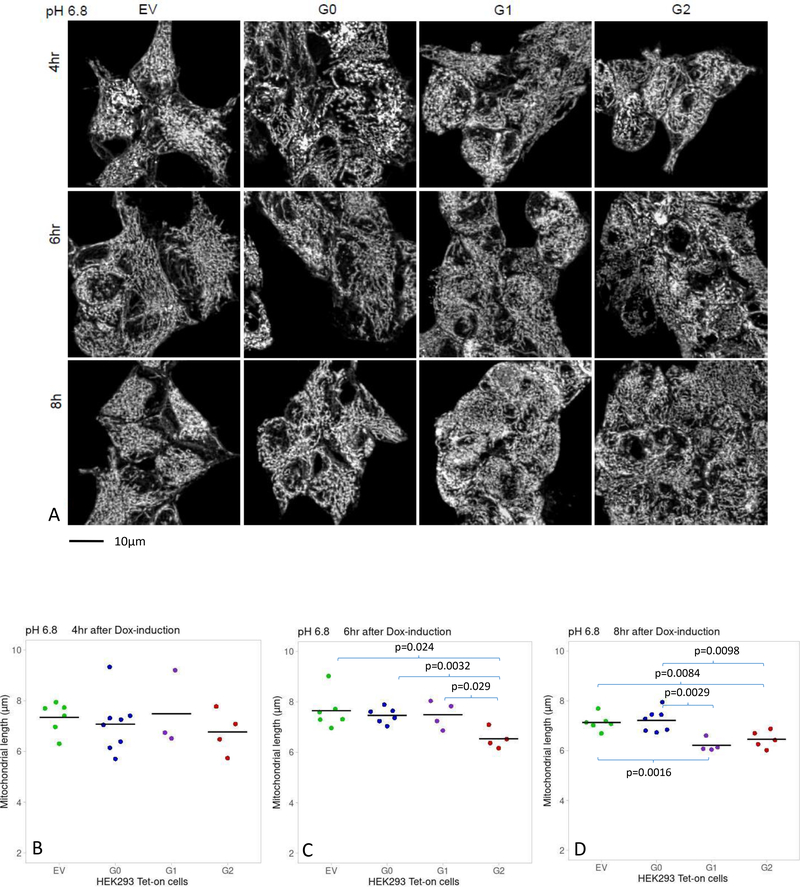
Figure 3. Comparison of mitochondrial length in Dox-induced HEK293 Tet-on cells cultured in media pH=6.8.
Panel A. Images displaying mitochondrial morphology in HEK293 Tet-on cells cultured in media pH 6.8 and Dox-induced for 4, 6 and 8 hours. The cells were imaged and processed as described in Figure 2, Panel A.
Panels B, C, D. Graphs display a summary of measurements of mitochondrial length in HEK293 Tet-on cells cultured in cell growth media pH 6.8 and Dox-induced for 4, 6 or 8 hours, respectively. B) Mitochondrial length was comparable in HEK293 Tet-on EV, G0, G1 and G2 cells after 4 hours of Dox-induction (p=NS, pair-wise t-test and ANOVA). C) Mitochondrial length was lower in HEK293 G2 cells than in EV, G0 or G1 cells after 6 hours of Dox-induction (t-test). D) Mitochondrial length was lower in HEK293 G1 or G2 cells than EV or G0 cells, after 8 hours of Dox-induction (t-test). Mitochondrial length was similar between EV and G0 cells, and between G1 and G2 cells (p=NS, t-test).

