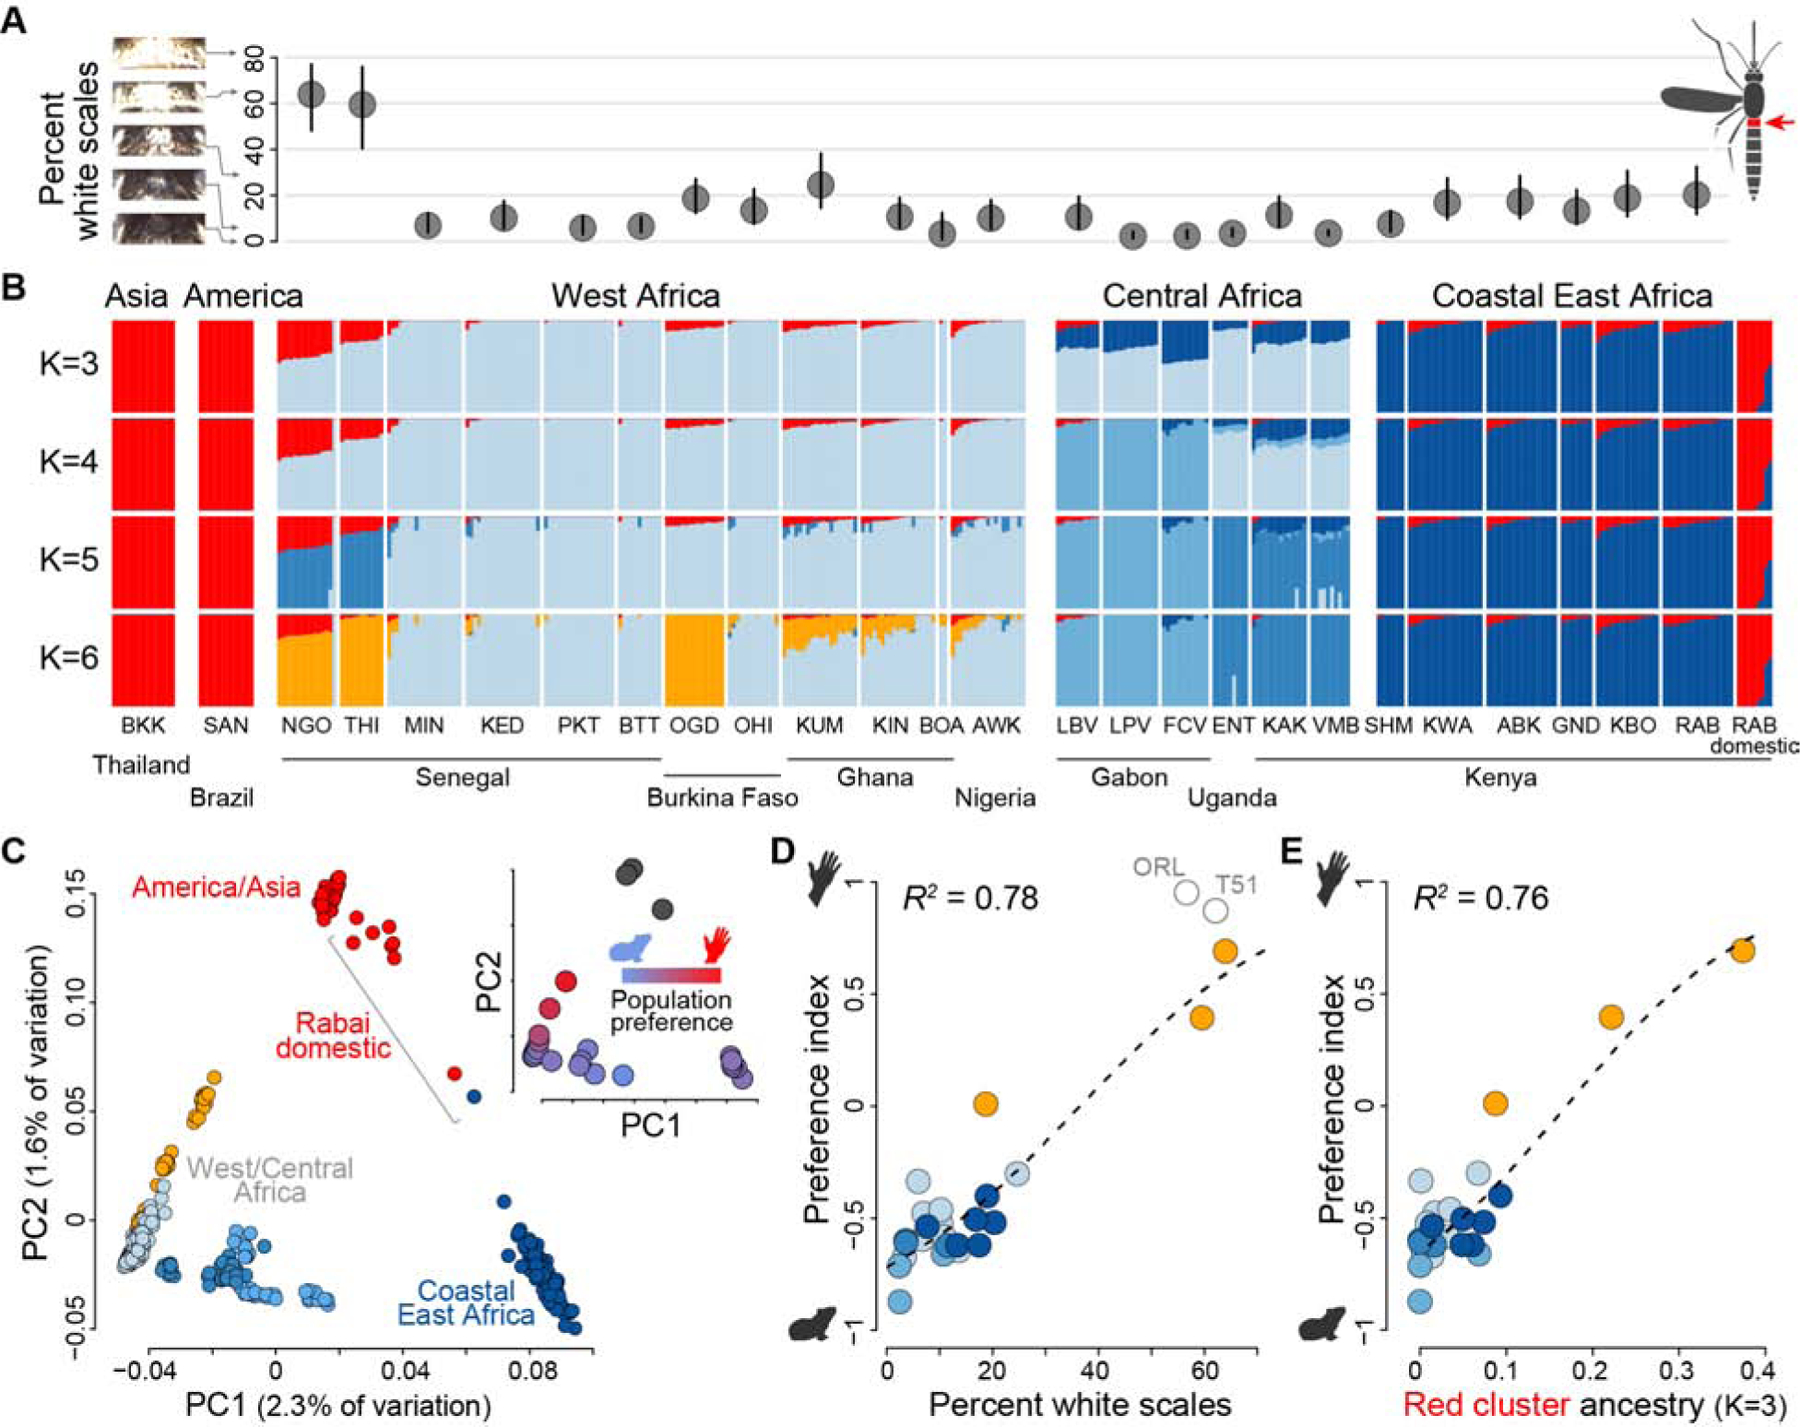
Figure 3. Specialization on humans has a single genomic origin.

(A) Percentage of the first abdominal tergite of adult females (red in inset, right) covered in white scales. Dots and lines show mean and 95% confidence intervals, respectively, for n=7–29 females from the populations listed in panel (B). (B) ADMIXTURE analysis of population structure. Bar plots show ancestry proportions for 375 mosquitoes when specifying K=3–6 ancestry components. K=3 minimized cross-validation error. (C) Principal components analysis of population structure. Points in the main plot represent individuals and are colored according to primary ancestry assignment from the K=6 ADMIXTURE analysis in (B). Points in the inset represent population means and are colored according to host preference. (D-E) Preference for humans is tightly correlated with both population mean abdominal scaling (D, linear model P=1.3×10⁻⁸) and mean proportion ancestry assigned to the red component in the K=3 ADMIXTURE analysis (E, linear model P=2.7×10⁻⁸). Point colors are as in the main plot of (C), except they represent primary ancestry assignment for each population rather than individual. Open grey circles in (D) show non-African reference populations (not included in correlation analysis).
