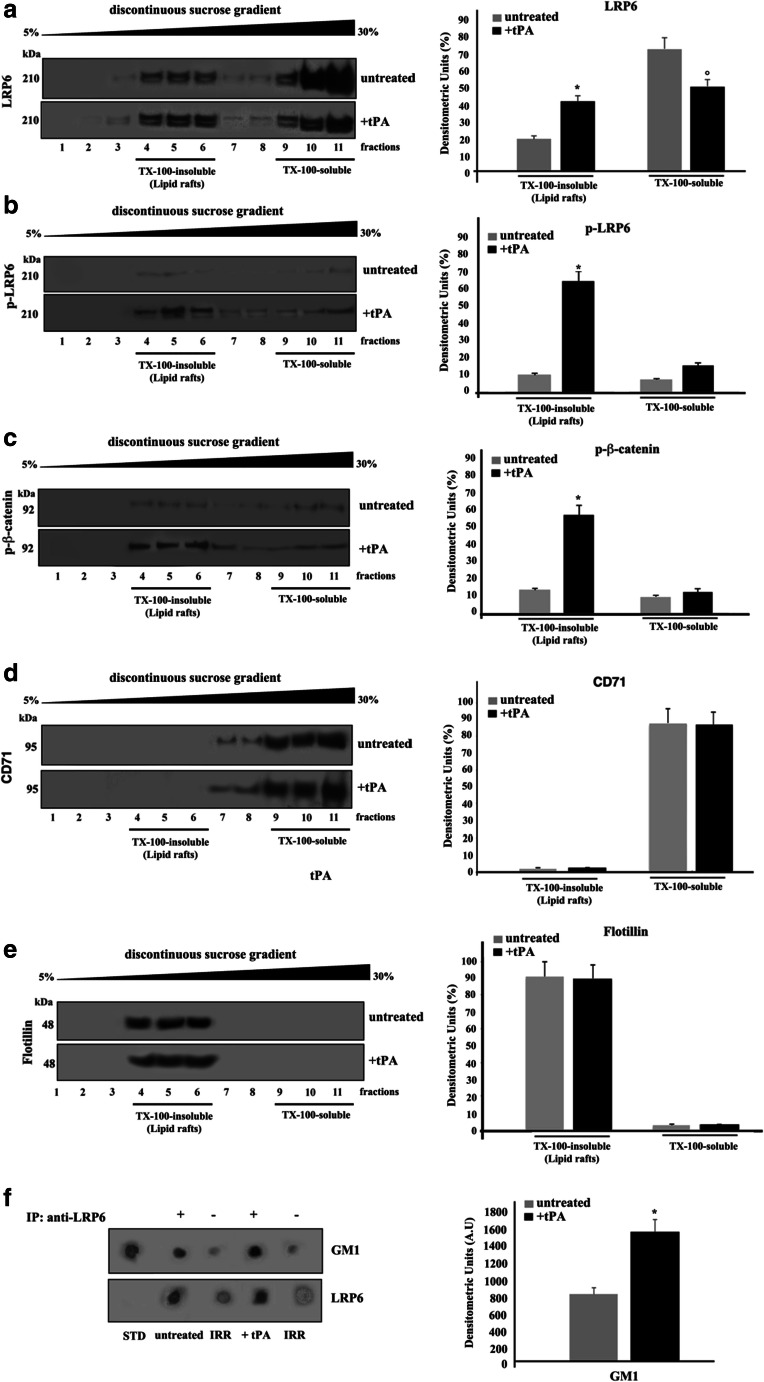
Fig. 1.
Lipid rafts localization of LRP6 in SK-N-BE2 cells. a-e SK-N-BE2 cells, either untreated or treated with 10 nM tPA for 10 min at 37 °C, were lysed and the supernatant fraction was subjected to sucrose density gradient. After centrifugation, the gradient was fractionated and each fraction was recovered and analyzed by western blot using anti-LRP6 pAb (a), anti-phospho LRP6 pAb (p-LRP6) (b), anti-phospho β-catenin (p-β-catenin) pAb (c), anti-CD71 mAb (d) or an anti-flotillin pAb (e). Right panel: Densitometric analysis of sucrose gradient fractions. The columns indicate the percent distribution across the gel of raft-fractions 4–5 and 6 (Triton X-100-insoluble fractions) and 9–10 and 11 (Triton X-100-soluble fractions), as detected by densitometric scanning analysis. Results represent the mean ± SD from three independent experiments (*) p < 0.01 TX-100-insoluble fractions from tPA-treated cells vs TX-100-insoluble from control cells; (°) p < 0.01 TX-100-soluble fractions from tPA-treated cells vs TX-100-soluble from control cells. f SK-N-BE2 cells, untreated or treated with 10 nM tPA, were lysed in lysis buffer, followed by immunoprecipitation with goat anti-LRP6 pAb. An IgG isotypic control was employed. The immunoprecipitates were spotted onto nitrocellulose strips and incubated with Cholera Toxin B Subunit-Peroxidase (from Vibrio Cholerae), as described in Materials and Methods. As a control, the immunoprecipitates were assessed by Dot-blot with anti-LRP6 mAb. A representative experiment among three is shown. Bar graph in the right panel shows densitometric analysis. Results represent the mean ± SD from three independent experiments. (*) p < 0.01 tPA vs control cells

