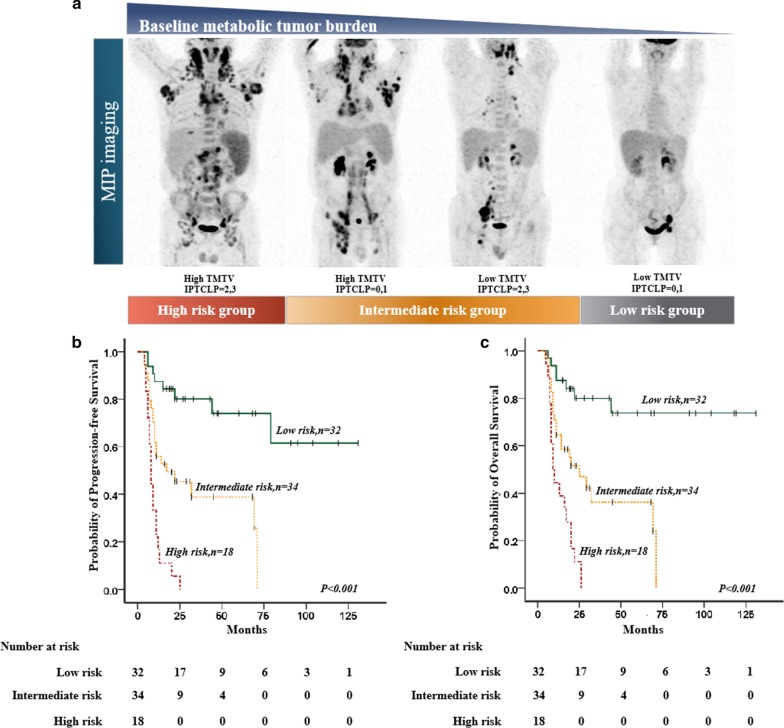
Fig. 2.
a Illustration of combination of total metabolic tumor volume and IPTCLP scores for risk substratification of PTCL patients using maximal intensity projection on FDG-PET images. b, c Three risk groups with the combination of baseline TMTV and IPTCLP scores: low-risk group (IPTCLP = 0, 1 and low TMTV, n = 32), intermediate-risk group (IPTCLP = 2, 3 or high TMTV, n = 34), and high-risk group (IPTCLP = 2, 3 and high TMTV, n = 18)

