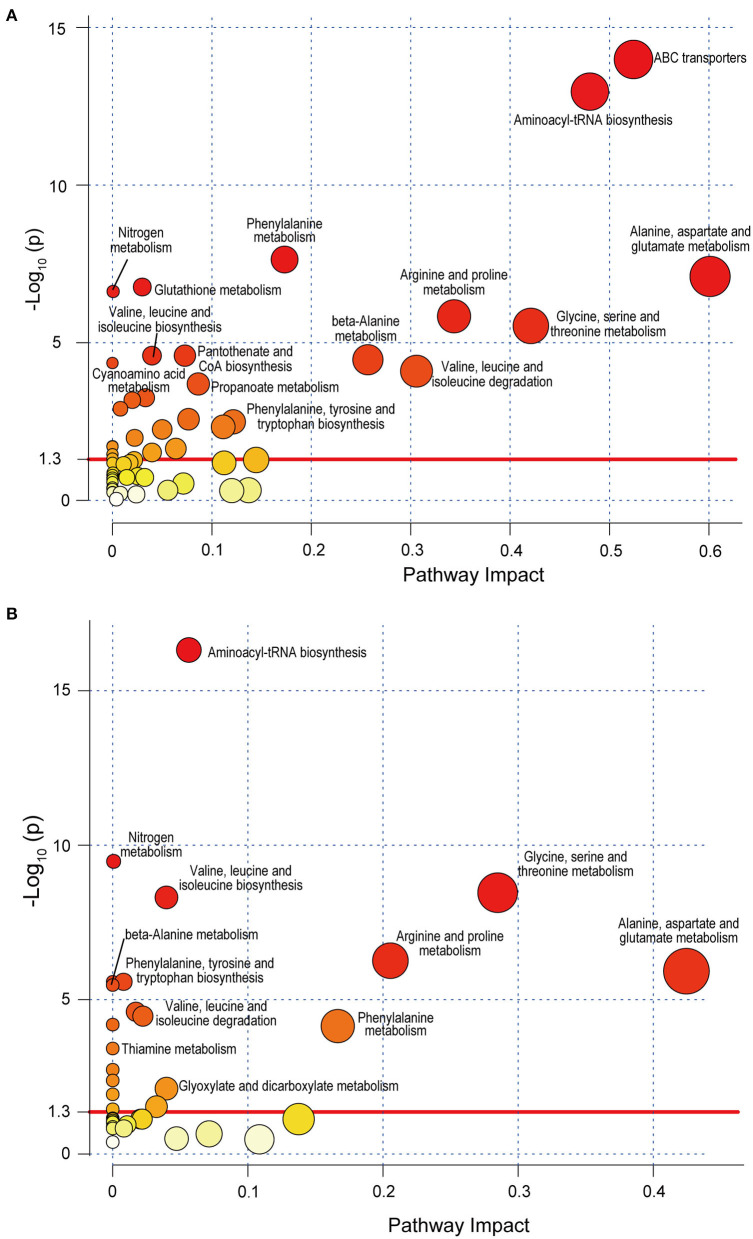
Figure 4.
Metabolic pathway analysis of SLE-altered metabolites using MetaboAnalyst 4.0 based on the KEGG. Circle colors indicate pathway enrichment significance. Circle size indicates the extent of pathway impact. Circle above the red line (–Log10 P > 1.30) represents significantly enriched pathway. (A) Pathway enrichment analysis based on KEGG full library. (B) Pathway enrichment analysis based on KEGG Homo sapiens library. SLE, systemic lupus erythematosus; KEGG, Kyoto Encyclopedia of Genes and Genomes.

