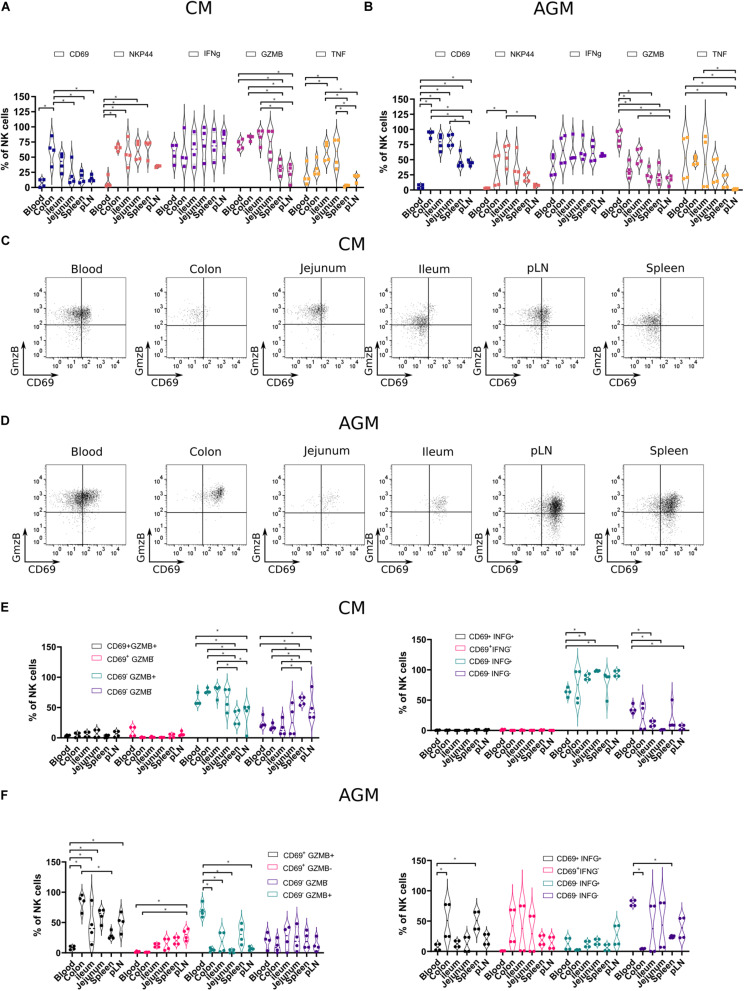
FIGURE 5.
Functional profiles of NK cells in tissues from chronically SIV-infected non-human primates. NK cells from four SIVmac-infected CMs and four SIVagm-infected AGMs were analyzed. (A,B) Vioplots showing the distribution of markers on bulk tissue NK cells. Each marker is labeled with a unique color. All comparisons between NK cells were carried out using a one-way analysis of variance (ANOVA) and followed by a Tukey’s multiple-comparison test. The latter is a post hoc test based on the studentized range distribution. (C,D) Representative dot plots showing NK cells according to CD69 surface expression and intracellular expression of GzmB in different tissues. Dot plots for a randomly chosen animal per species are shown. (E,F) Graphics showing frequencies of NK cells subsets in different tissues according to CD69 and Grzm B expression (left) or CD69 and IFN-g expression (right). All comparisons were carried out using a one-way ANOVA and followed by a Tukey’s multiple-comparison test. The latter is a post hoc test based on the studentized range distribution. Median and standard error bars are shown. Asterisks indicate a p-value <0.05.

