FIGURE 5.
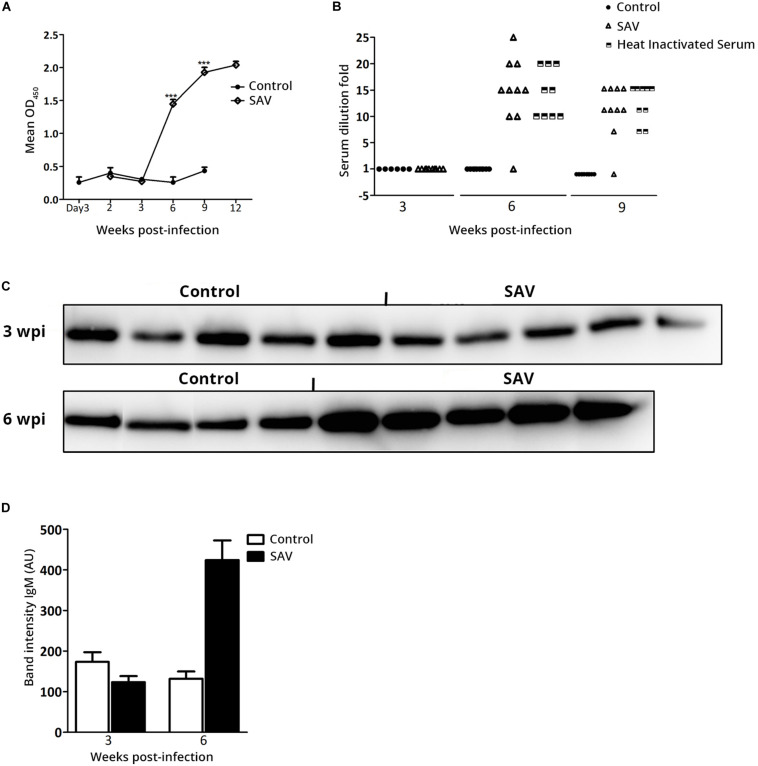
Atlantic salmon mounts antibody-mediated anti-viral response against SAV3 infection. (A) Anti-SAV3 E2 antibody response in serum from control and SAV3 infected Atlantic salmon were analyzed using ELISA (data presented as mean OD450 + SEM; n = 6 for control and n = 10 for infected). (B) Virus neutralizing titers in serum from control and SAV3 infected Atlantic salmon before and after heat inactivation (Scatter plot of individual values; n = 6 for control and 10 for infected). (C) Representative Western blots showing total IgM protein in individual serum samples at 3 and 6 wpi in control (n = 4) and SAV3 infected Atlantic salmon (n = 5). (D) Mean band intensity of IgM (AU, arbitrary units) determined by subtracting the background noise from the visualized bands from blots shown in panel (C).

