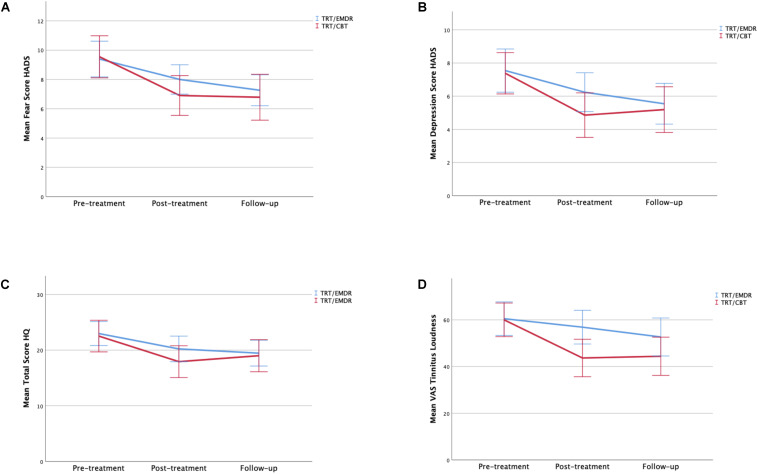
FIGURE 6.
(A) Mean of total fear scores by therapy group and time period. (B) Mean of total depression scores by therapy group and time period. (C) Mean of total HQ scores by therapy group and time period. (D) Mean of total VAS scores of tinnitus loudness by therapy group and time period. Error bars representing 95% CI interval.

