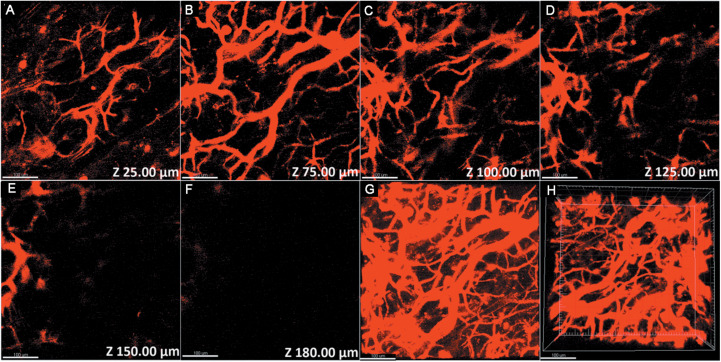
FIGURE 4.
3PL imaging of ear blood vessels of a mouse treated with PS-PEG@TB NPs at various vertical depths: (A) 25 μm, (B) 75 μm, (C) 100 μm, (D) 125 μm, (E) 150 μm, and (F) 180 μm. (G) A stacked three-photon fluorescence image from a depth of 0 to 180 μm. (H) A 3D reconstructed image showing the distribution of the PS-PEG@TB NPs in the ear blood vessels of the mouse. Scale bar: 100 μm.

