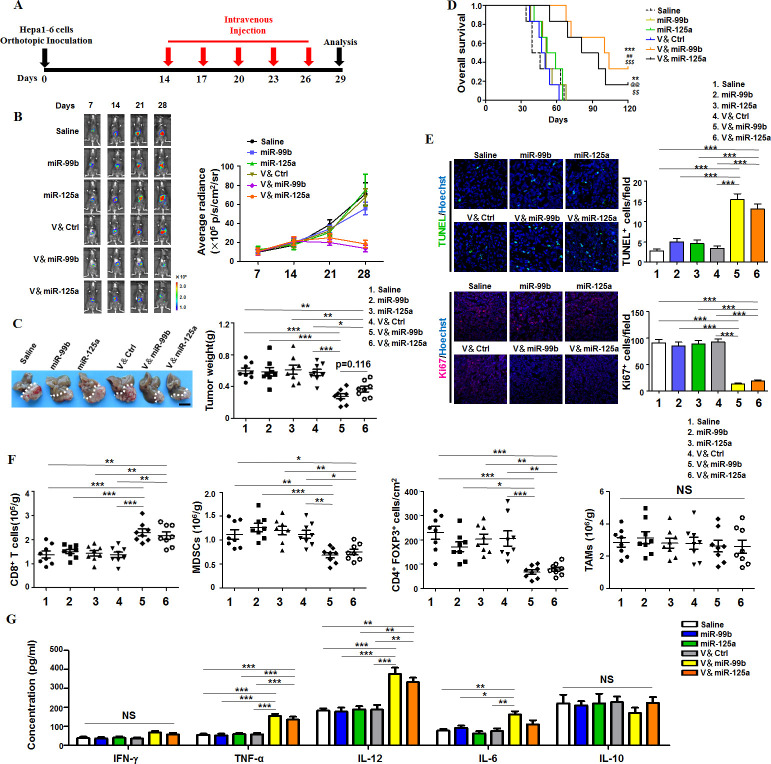
Figure 1.
TAM-targeted delivery of miR-99b or miR-125a inhibited orthotopic HCC growth. (A) Schedule of HCC therapy by TAM-targeted delivery of miR-99b or miR-125a or control (Ctrl) agomir via mouse tail vein. HCC model was established by orthotopic hepatic inoculating Hepa1-6 cells that carry luciferase expression. (B) HCC-bearing mice were treated with different drugs according to the schedule as shown in (A). The HCC growth was monitored at different time points under a Xenogen IVIS system after intraperitoneal injection with luciferin. Average radiance was compared among each group (n=8). (C) Tumors were dissected and photographed at day 29 after treatment with different drugs as shown in (B). Tumor weight were measured and compared (n=8). (D) The survival curves of tumour-bearing mice were observed after treatment with different drugs as shown in (B). **p<0.01 and ***p<0.001 (vs saline); ##p<0.01 (vs miR-99b); $$p<0.01 and $$$p<0.001 (vs V&Ctrl); @@p<0.01 (vs miR-125a) using log-rank (Mantel-Cox) test. (E) HCC apoptosis and proliferation were detected using TUNEL (upper panel) and Ki67 staining (lower panel) after treatment with different drugs as shown in (B) (n=8). (F) The absolute immune cell numbers of HCC was calculated after FACS assay or histology immunofluorescence staining, including CD8+T cells, MDSCs, Treg cells and TAMs (n=8). (G) Serum from tumour-bearing mice with different drug treatment was collected and the concentration of the indicated cytokines was determined by ELISA (n=4). Data are shown as mean±SEM. * p<0.05; **p<0.01; ***p<0.001 using one-way ANOVA with Tukey’s multiple comparison test (C, E–G). ANOVA, analysis of variance; HCC, hepatocellular carcinoma; MDSCs, myeloid-derived suppressor cells; TAM, tumor-associated macrophage.

