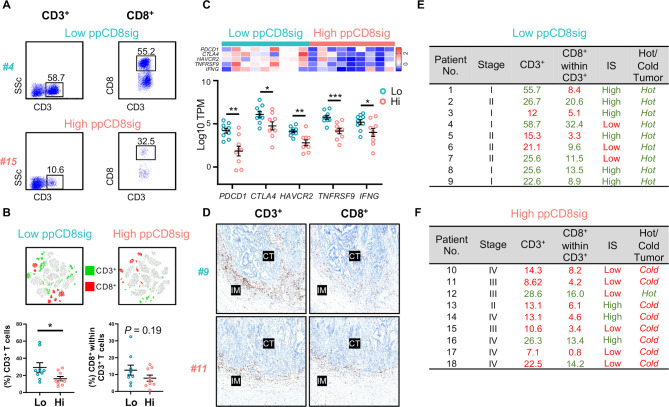
Figure 6.
Densities of T cell infiltration, Immunoscores and classification of hot and cold tumors in patients with high and low ppCD8sig scores. Representative flow cytometric plots showing the percentage of CD3+ and CD3+CD8+ TILs from a patient with CRC with low ppCD8sig score (patient #4) and a patient with high ppCD8sig score (patient #15) (A). t-SNE plots representing the density of CD3+ and CD3+CD8+ TILs from nine patients with CRC with low ppCD8sig or nine patients with high ppCD8 score (B). Scatter plots for the percentage of CD3+ and CD3+CD8+ TILs from patients with CRC with low ppCD8sig and high ppCD8sig scores. Each dot represents an individual patient; mean±standard error of the mean (SEM) are shown (B). Heatmap representing the fold change in gene expression as Z-scores, and scatter plot representing gene expression as log10 TPM to compare the expression of immune checkpoint genes and IFNG in CD8+ TILs from patients with high versus low ppCD8sig scores (C). Representative images of immunohistochemical staining for CD3+ and CD8+ T cells in the center of tumor (CT) and invasive margin (IM) from a patient with low ppCD8sig score (patient #9) and a patient with high ppCD8sig score (patient #11) (D). The percentages of TILs, Immunoscore (IS) categorization, and tumor classification as ‘hot’ or ‘cold’ for patients with low ppCD8sig score (E) and patients with high ppCD8sig score (F). CRC, colorectal cancer; TILs, tumor-infiltrating lymphocytes; TPM, transcripts per million.

