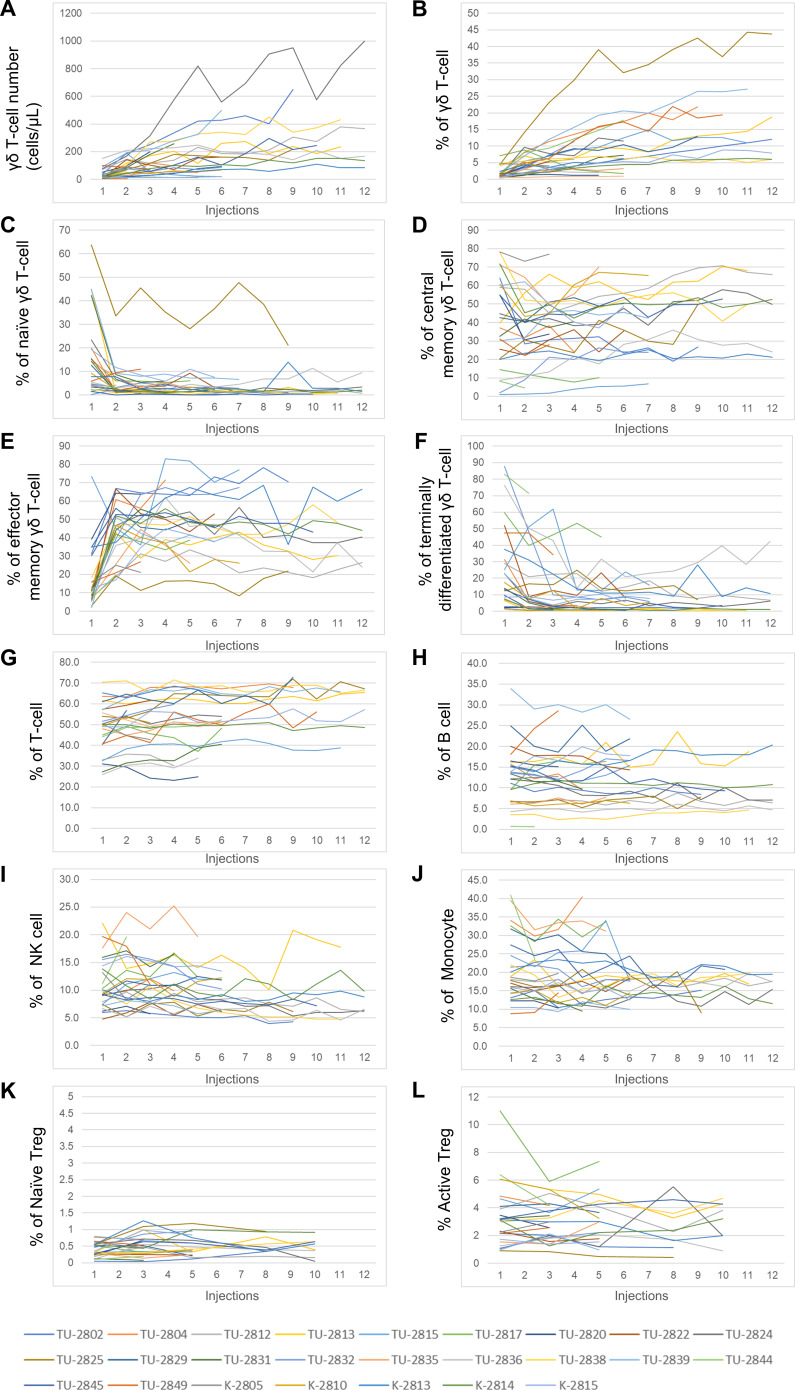
Figure 4.
Immunomonitoring of the 25 patients enrolled. (A) Number of γδ T-cells per μL in blood at the time of injection. (B) The percentage of γδ T-cells in PBMC. (C) The percentage of CD45RA+CD27+ naïve γδ T-cells in PBMC. (D) The percentage of CD45RA-CD27+ central memory γδ T-cells in PBMC. (E) The percentage of CD45RA-CD27- effector memory γδ T-cells in PBMC. (F) The percentage of CD45RA+CD27- terminally differentiated γδ T-cells in PBMC. (G) The percentage of CD3+ T-cells in PBMC. (H) The percentage of CD19+ B cells in PBMC. (I) The percentage of CD3-CD56+ NK cells in PBMC. (J) The percentage of CD14+ monocytes in PBMC. (K) The percentage of CD45RA+FOXP3+ naïve regulatory T cells (Treg) in PBMC. (L) The percentage of CD45RA-FOXP3++active Treg in PBMC. Each color-coded line indicates one patient.

