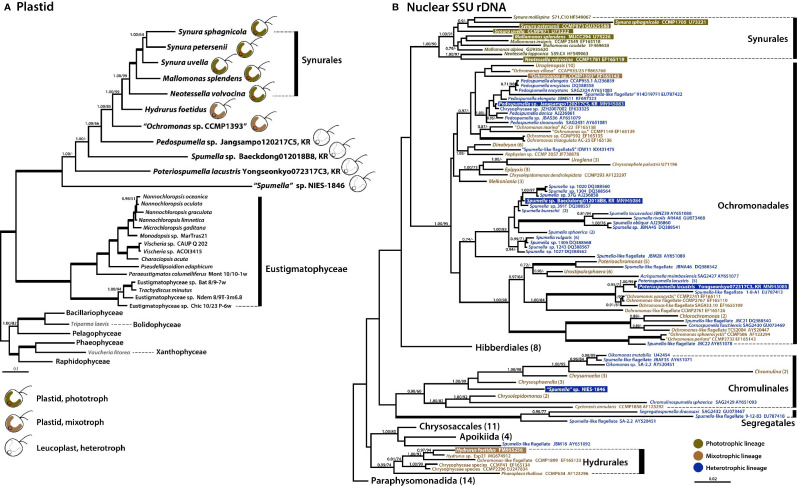
Figure 4.
Phylogenies of phototrophic, mixotrophic, and heterotrophic chrysophytes. (A) Plastid genome-based Bayesian tree of chrysophytes and other stramenopile taxa. The topology of this tree (inferred from an alignment of 40 proteins and 8,267 amino acids) is consistent with a single acquisition of photosynthetic ability from a red alga-derived secondary plastid in a chrysophyte ancestor. The numbers on each node represent posterior probabilities (left) and ultrafast bootstrap approximation (UFBoot) values calculated using IQ-Tree (right). Thick branches indicate fully supported nodes (PP = 1.00/ML = 100). This tree shows the phylogenetic relationships of chrysophytes and other stramenopiles based on a subset of taxa; for phylogenies inferred using a fully expanded dataset, refer to Supplementary Figures S1 and S3 . (B) Nuclear SSU rDNA tree of chrysophytes showing the putative relationships of the phototrophic chrysophyte lineage in the context of non-photosynthetic lineages. Sequences from the strains whose plastid genomes were sequenced in this study are highlighted. Together, the plastid and nuclear gene tree topologies suggest parallel evolution of chrysophyte plastid genomes in response to shifts to heterotrophy. The numbers on each node represent posterior probabilities (left) and maximum-likelihood (ML) bootstrap support values calculated using RAxML (right). Support values (PP < 0.70/ML<70) are shown on each node. Bold branches indicates fully supported values (PP = 1.00/ML = 100). The numbers in () are indicate the number of taxa in the species, genus, or order. The species name with “ “ indicates uncertain taxonomic status. An expanded phylogeny based on a much larger dataset is provided in Supplementary Figure S2 . The scale bars indicate the number of substitutions/site.

