Figure 1.

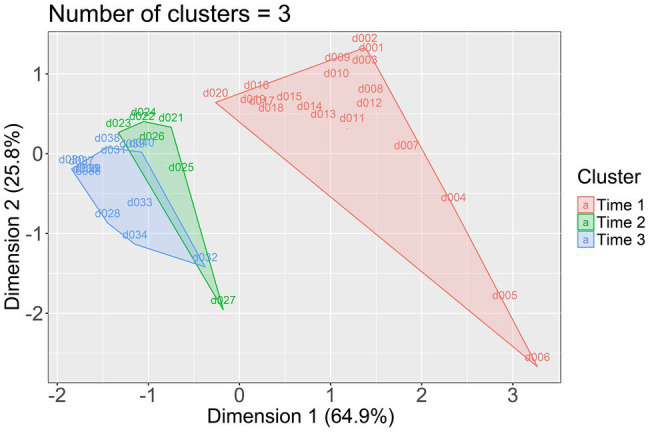
Plot of the three clusters (Time 1, Time 2, and Time 3). Dimension 1 explained 64.9% of the variance; dimension 2 explained 25.8% of the variance.

Plot of the three clusters (Time 1, Time 2, and Time 3). Dimension 1 explained 64.9% of the variance; dimension 2 explained 25.8% of the variance.