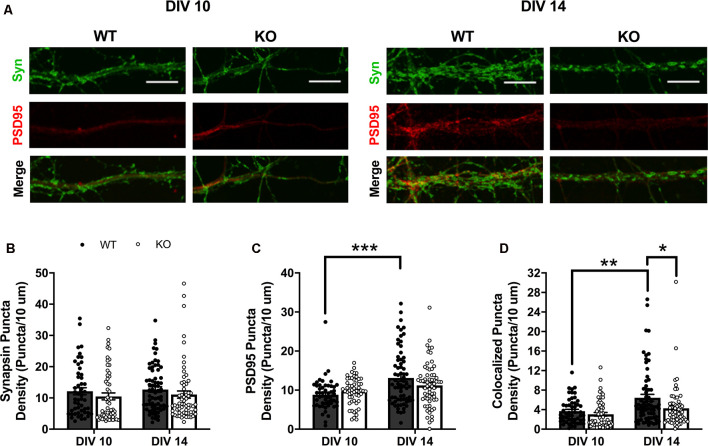
Figure 1.
Expression of presynaptic (synapsin I; green) and postsynaptic (PSD95; red) markers in wildtype (WT) and Fmr1 knockout (KO) medium spiny neurons (MSNs) at day in vitro (DIV) 10 and 14 (A; scale bars are 10 μm). Synapsin I expression did not vary between genotypes or across the two time-points (B; two-way analysis of variance, ANOVA). WT cells have significantly increased density of PSD95 at DIV 14 compared to DIV 10, but KO cells show no change in expression level between the two time points (C; two-way ANOVA). Only WT cells increase the density of colocalized pre- and postsynaptic markers from DIV 10 to 14, with KO cells showing a significant deficit at DIV 14 compared to WT counterparts (D; two-way ANOVA). Significant Bonferroni comparisons are indicated (*p < 0.05, **p < 0.01, ***p < 0.001); data shown are mean ± SEM.

