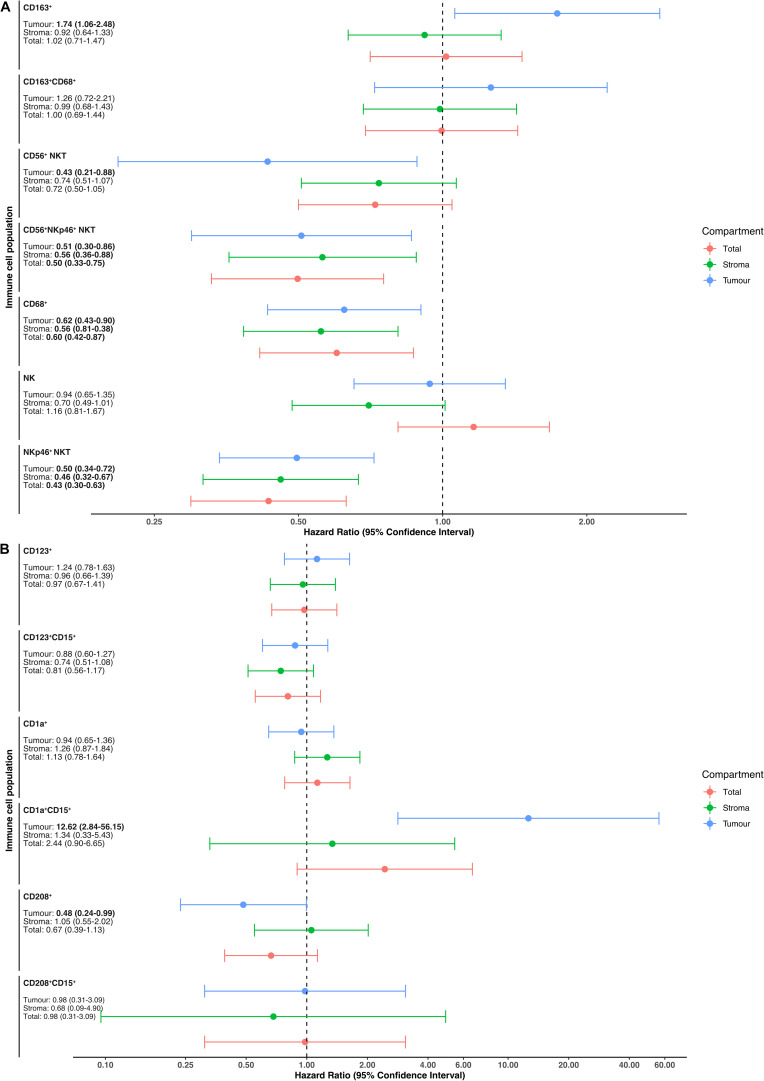
FIGURE 4.
Prognostic impact of immune cell subsets in the entire cohort. (A) Forest plots depicting hazard ratios of death within 5 years according to the density of leukocytes characterized in panel 1. (B) Forest plots depicting hazard ratios of death within 5 years according to the density of leukocytes characterized in panel 2.

