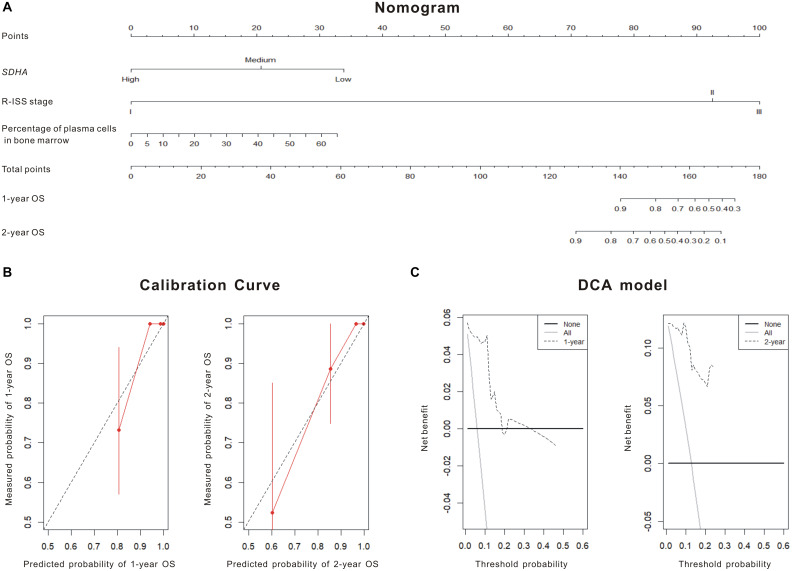
FIGURE 2.
SDHA overexpression was involved in the prognosis model of MM patients. (A) Nomogram diagram shows three variables of the best prognosis prediction model in Cox regression, including expression of SDHA, R-ISS stage and percentage of plasma cells in bone marrow. The integral weight of each variable is shown in the figure. This diagram also predicted the relationship between this model and 1-year and 2-year survival rates of MM patients. (B) The calibration chart of patients’ prognosis model was based on Cox regression. The calibration curve was plotted to evaluate the agreement of nomogram. Calibration curve reflects the agreement between observed outcomes and predictions. A calibration plot has the predicted probabilities on the x-axis, and the mean observed outcome on the y-axis, and a perfect calibration should lie on or around a 45° line of the plot. Red solid line was the survival prediction of MM patients, while black virtual line was the actual survival rate of MM patients. (C) Decision curve analysis (DCA) of the 1 and 2-year overall survival. DCA was also used to evaluate the discrimination of the model and recent years have seen an explosion of interest in and practical use of decision curve analysis. The horizontal solid line referred to “none patient was dead” in 1- or 2-year follow-up and the thin line referred to “all patients were dead” in 1- or 2-year follow-up. The dotted line referred to the prediction of our 1- or 2-year model. All = assume all patients survive, None = assume none patient survives.

