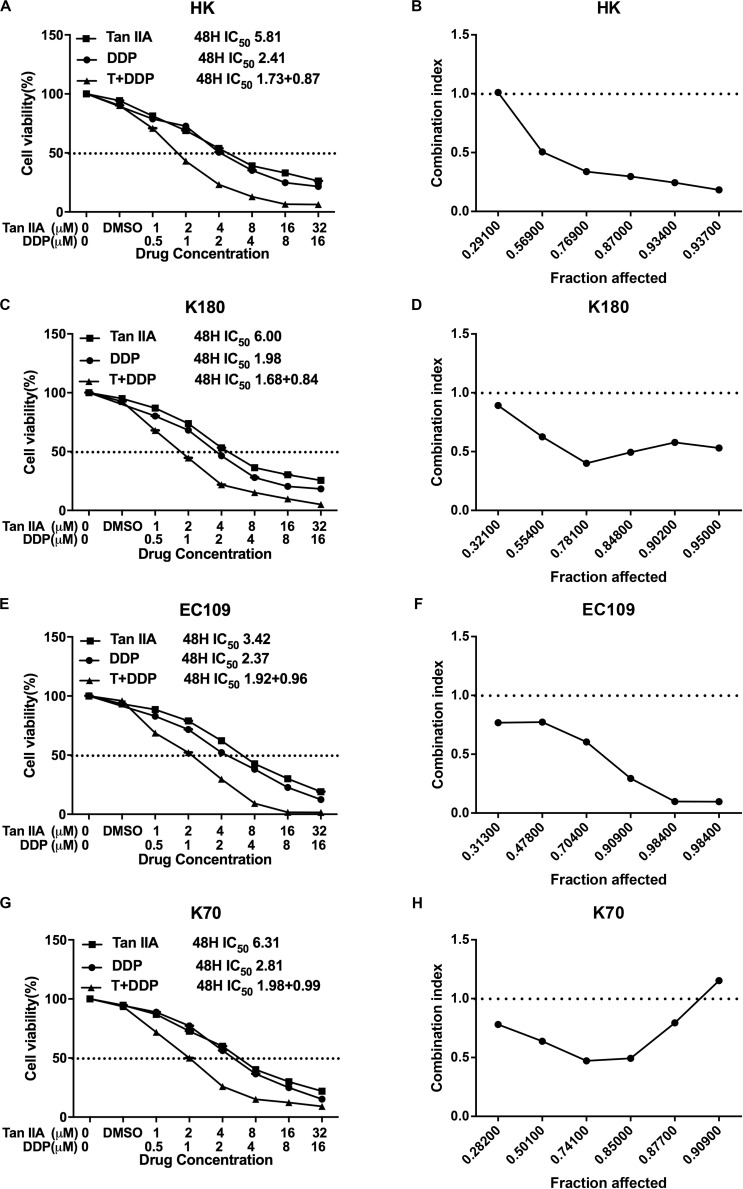
FIGURE 2.
The proliferative inhibition effect of Tan IIA, DDP, and the combination treatment on ESCC cells. Drug concentration-Cell viability curves were generated as the viable cell percentage based on the cell viability assay (A,C,E,G). Synergistic effects between Tan IIA and DDP were exhibited as Fa-CI plots (B,D,F,H). Data are from three repeated experiments with quadruplicate wells, (mean ± SD).

