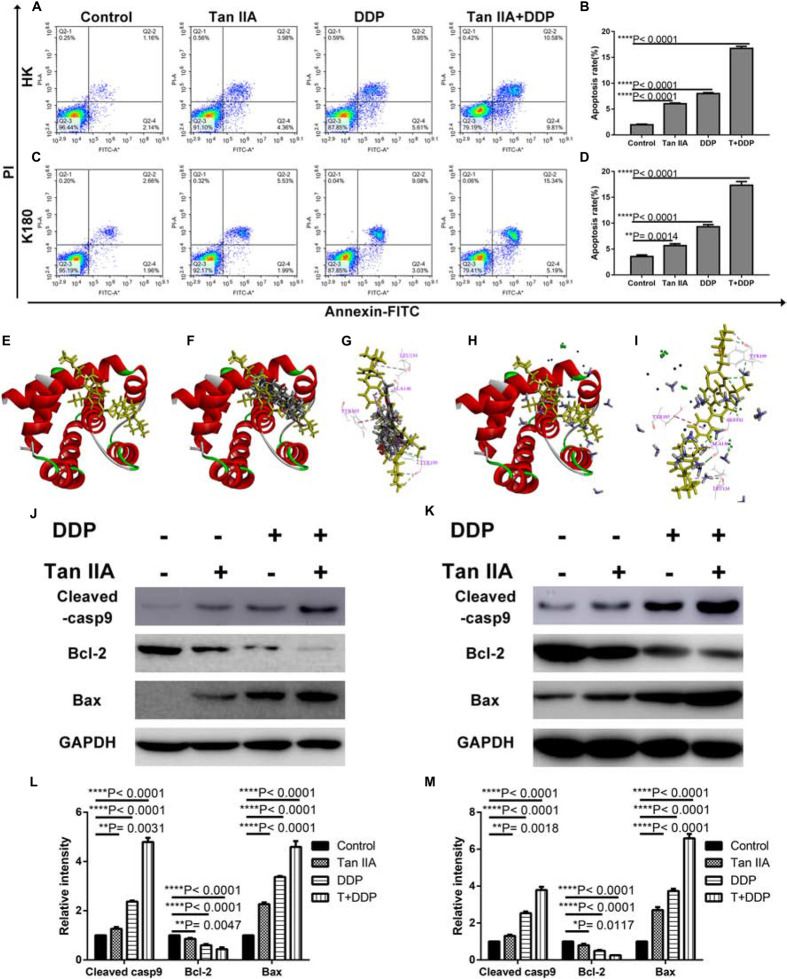
FIGURE 5.
Effect of Tan IIA, DDP alone and in combination on apoptosis. Representative profiles showing apoptosis in HK (A) or K180 cells (C) treated with 6 μM Tan IIA, 3 μM DDP alone and 1 μM DDP and 2 μM Tan IIA in combination for 48 h. Data represent the cell population of cell cycle arrest of HK (B) and K180 (D) cells. The 3D crystal structure of human Bcl-2 with an endogenous ligand (PDB-ID: 4lvt) (E). Ten random poses of Tan IIA docked into the active site of 4lvt (F). The binding modes of Tan IIA in Bcl-2: at least four residues involved in the interactions in ten random poses, TYR 199 (H-bonds) and TYR 105, LEU 134, ALA 146 (π-π interaction) (G). Ten random poses of DDP docked into the same active site of 4lvt (H). The binding modes of DDP in Bcl-2: at least five residues involved in the interactions in ten random poses, ASN 142, TYR 199 (H-bonds) and TYR 105, LEU 134, ALA 146 (π-π interaction) (I). Protein expression levels of Cleaved casp9, Bcl-2, Bax, and GAPDH of HK (J) and K180 (K) cells following 48 h treatment with 6 μM Tan IIA, 3 μM DDP alone and 1 μM DDP and 2 μM Tan IIA in combination. Histograms depict the relative gray value of the related proteins measured using Image J (L,M). All data are shown as the mean ± SD of three independent experiments. **P < 0.01 or ****P < 0.0001 versus the control group.

