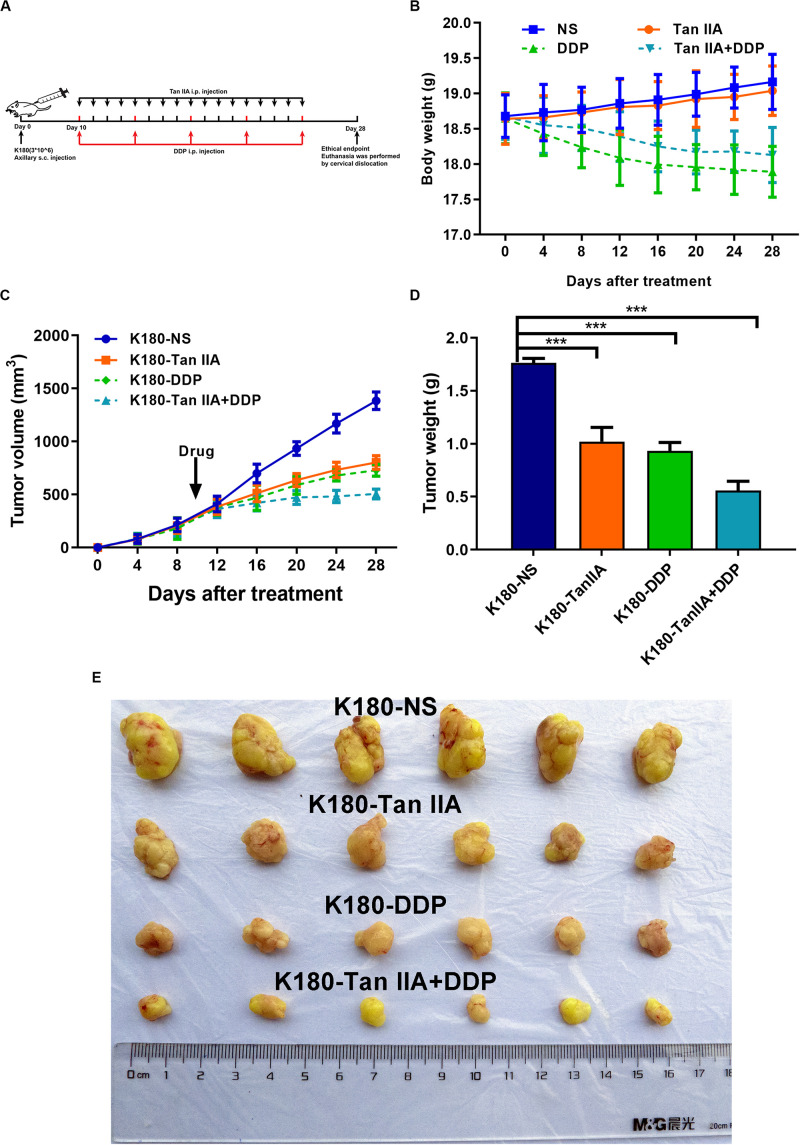
FIGURE 6.
Tan IIA, DDP alone and in combination suppress the growth of K180 cells in vivo. Timeline of K180 cells inoculation and drug treatment (A). Time courses of animal weight (B). Tumor volume of all groups was measured every 4 days, beginning the first day after injection until the study end point. Data are shown as growth curves (C). Tumor mass of all groups was measured and compared, ***P < 0.001 versus the control group (D). Tumors derived from K180 cells in six male nude mice are presented (E).

