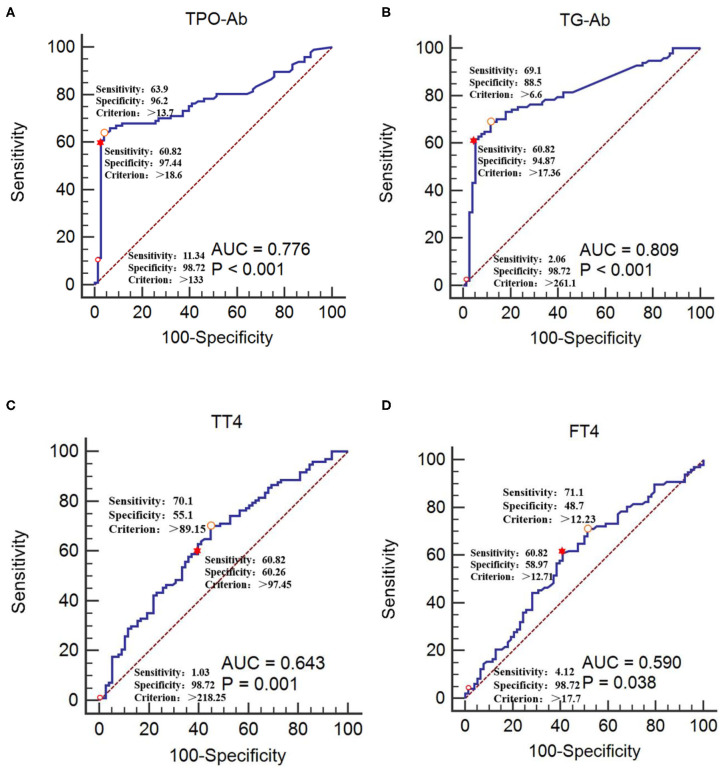
Figure 3.
Receiver operating characteristic curves of TPO-Ab, TG-Ab, TT4, and FT4 for GBS occurrence (A) TPO-Ab, (B) TG-Ab, (C) TT4, and (D) FT4. The CIDP group was used as the reference group, and the GBS group was used as the measurement group.  The diagnostic cut-off value corresponds to the maximum point of the Youden index.
  The diagnostic cut-off value corresponds to the maximal specificity.
  The diagnostic cut-off value corresponds to sensitivity near to 60%.

