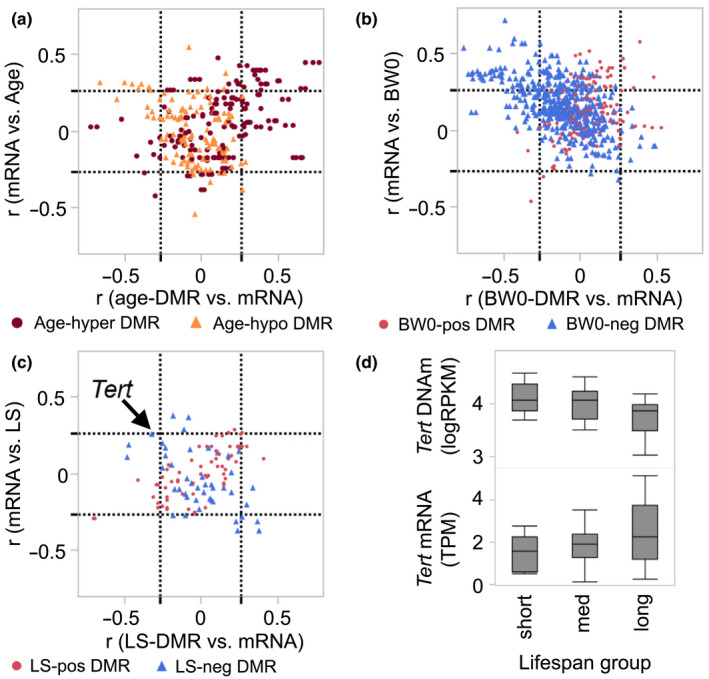
FIGURE 4.

Comparison between DMRs and expression of cognate genes. (a) The plot shows correlations between the age‐DMRs and expression of corresponding transcripts (Pearson r on x‐axis), and the correlation between the transcript and age of mice (y‐axis). The dashed lines demarcate the nominally significant |r| = 0.27 threshold (p ≤ 0.05; n = 52 samples with matched MBD‐seq and RNA‐seq). Most of the age‐hypermethylated DMRs (burgundy circles) are positively correlated with mRNA, and these mRNAs also tend to be positively correlated with age (top right square of graph). A few of the age‐hypomethylated‐DMRs (sandy brown triangles) have negative correlation with gene expression, and the corresponding transcripts are positively correlated with age (top‐left square). (b) Majority of the BW0‐DMRs are negatively associated with BW0 (blue triangles), and most of the DMR‐mRNA pairs are located in the top‐left square of the plot, that is, gene expression is negatively correlated with DNA methylation and positively correlated with BW0. A few of the BW0‐DMRs that have positive associations with BW0 (red circles) also have positive correlations with gene expression (top right square). (c) The few LS‐DMRs have modest correlations with gene expression. The DMR for Tert is negatively correlated with transcript (arrow), and the transcript has modest correlation with median life span at r = 0.26 (p = 0.07). (d) Comparison of DNA methylation levels (top) in the three life span groups shows significantly lower methylation in the long‐lived group (F 2,66 = 7.67, p = 0.001). A similar comparison for gene expression shows a significantly higher gene expression in the long‐lived group (F 2,49 = 3,31, p = 0.04)
