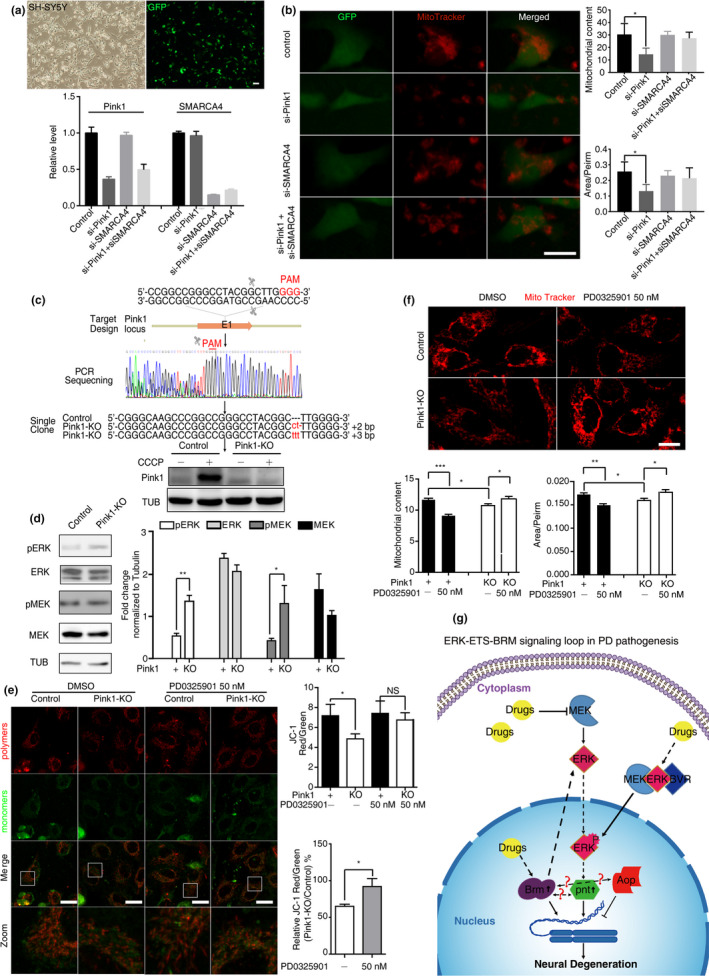
FIGURE 6.

Knockdown of SMARCA4 or drug inhibition of MEK‐ERK signaling ameliorated mitochondrial defects in the PINK1 deficient human cells. (a) Knockdown of SMARCA4 and PINK1 by RNAi in SH‐SY5Y cells. Cells were transfected with interference dsRNAs of PINK1, interference dsRNAs of SMARCA4, interference dsRNAs of PINK1 and SMARCA4, respectively, interference dsRNAs of Luciferase were transfected as RNAi control. Relative expression of PINK1 and SMARCA4 were quantified, at least 3 repeats per column were calculated. Scale bars, 10 μm. (b) SMARCA4 knock down significantly mitigated the aberrant mitochondrial content and interconnectivity caused by PINK1 RNAi SH‐SY5Y cells. Mitochondria were stained with MitoTracker‐Red. The mean mitochondrial content and mitochondrial interconnectivity index (Area/Perim) are shown as mean ± SD. *: indicates Mann–Whitney p < 0.05, **: indicates p < 0.01. NS, not significant. Scale bars, 10 μm. (c) CRISPR/Cas9 to establish the PINK1 −/− HeLa cell line. Schematic overview of the strategy used to generate the pink1 knockout allele, Sanger sequencing was used to identify the targeted mutations, and Western blot analysis verified the loss of PINK1 protein. Control or PINK1 KO HeLa cells, untreated (‐) or treated (+) with the protonophore m‐chlorophenylhydrazone (CCCP) were used; CCCP was used to prevent PINK1 protein from degradation (Narendra et al., 2010). (d) Over‐activated MEK/ERK signaling in PINK1 −/− HeLa cells. (e) Inhibition of MEK‐ERK signaling by PD0325901 rescued mitochondrial membrane potential (MMP) defects in PINK1 −/− HeLa cells. The mean ratio of the JC‐1 dye intensity in red channel to green channel is shown as mean ± SD to quantify MMP. Relative MMP between PINK1 −/− and control is also shown. (f) Inhibition of MEK/ERK signaling improved mitochondrial content and mitochondrial interconnectivity in PINK1 −/− HeLa cells. Mitochondria were stained with MitoTracker‐Red. The mean mitochondrial content and mitochondrial interconnectivity index (Area/Perim) are shown as mean ± SD. The drug solvent used was DMSO, and equivalent amounts of DMSO were used in parallel to the drug as a treatment control. Representative confocal images and quantifications are shown. *indicates Mann–Whitney p < 0.05, **indicates p < 0.01, ***indicates p < 0.001. NS, not significant. Scale bars, 10 μm. (g) A mechanistic model of the signaling loop in normal aging and PD pathogenesis is proposed, and the potential drug intervening points are illustrated
