
Figure 1.
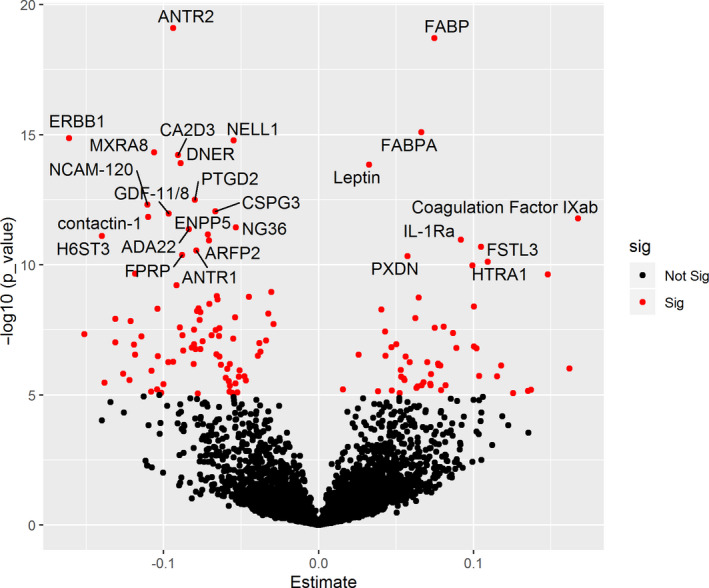
Association of proteins with frailty phenotype. Volcano plot showing associated proteins as red dots (p‐value < 1.0 × 10⁻⁵) X‐axis denotes the Beta estimates coefficient from linear model and Y‐axis shows the significance level presented as –log10 (p‐value). Top proteins have been annotated