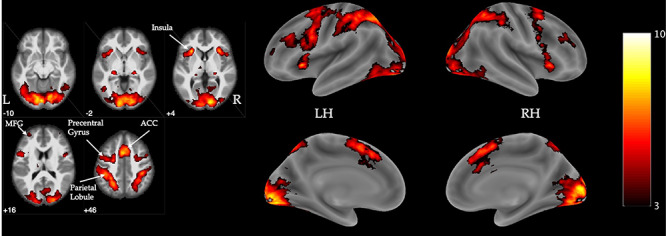
Fig. 5 .

Visualization of significant activation for the contrast of MR-post decisions versus baseline. Flame1, Z > 3.0, FWE-corrected p < 0.05, outliers deweighted. Color bar indicates Z intensity values. Coordinates are z-plane in MNI space. LH = left hemisphere, RH = right hemisphere, MFG = middle frontal gyrus, ACC = anterior cingulate cortex. N = 57.
