
Fig. 6 .
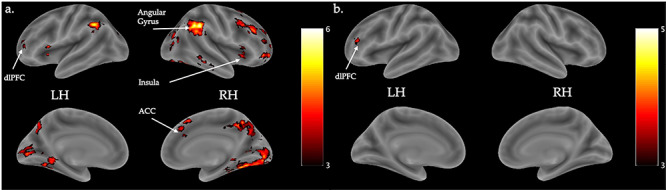
(a) Visualization of activation showing linear decreases in activation across trials for the contrast of tweets versus baseline, irrespective of changes in negative affect. (b) Visualization of activation showing increased linear change across trials for the contrast of tweets versus baseline and correlated with more extreme changes in negative affect. Flame1, Z > 3.0, FWE-corrected p < 0.05, outliers deweighted. Color bar indicates Z intensity values. LH = left hemisphere, RH = right hemisphere. N = 57.