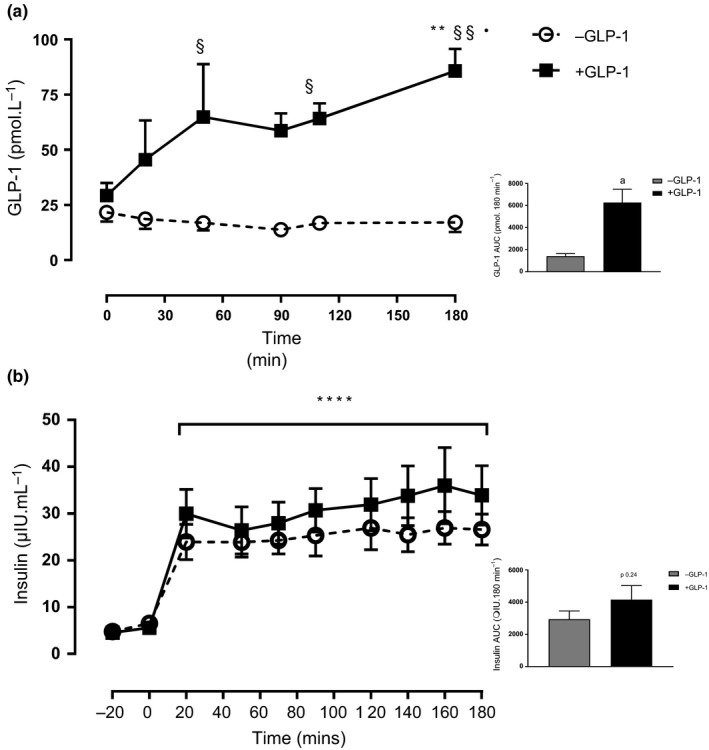
FIGURE 1.

GLP‐1 concentration over 180 min postprandial clamp (a) and AUC above baseline (inset). Insulin concentrations at fasted and following fed‐state clamp with and without GLP‐1 (b) and insulin AUC above baseline (inset). **p < 0.01 versus respective fasted value, § p < 0.05 versus – GLP‐1 respective time point, §§ p < 0.01 versus –GLP‐1 respective time point, ****p < 0.0001 versus respective fasted values. a p < 0.01 versus – GLP‐1. Data reported as mean ± SEM
