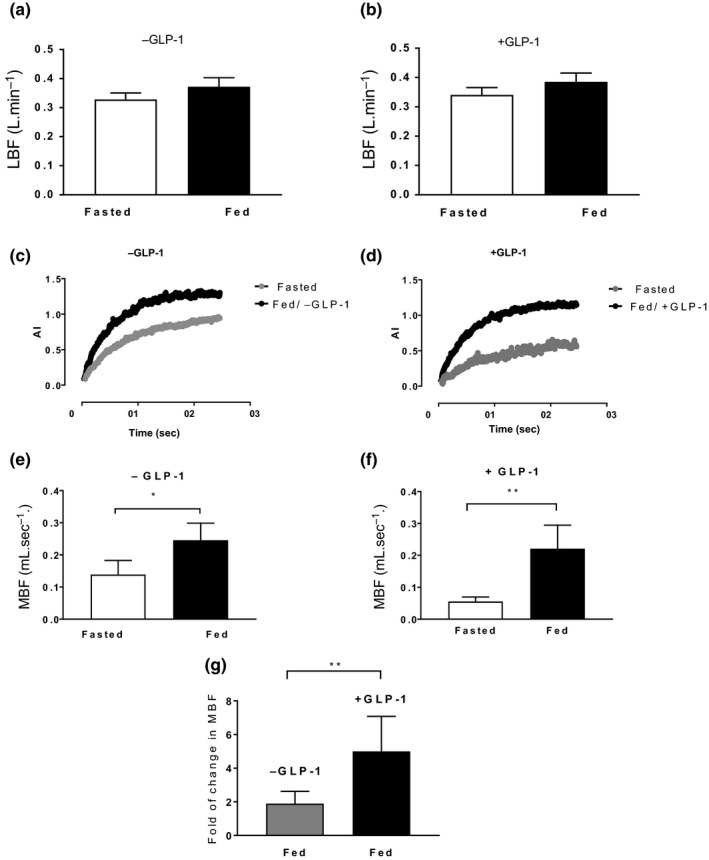
FIGURE 4.

Microvascular responses to postprandial insulin ± GLP‐1 measured by CEUS. LBF measured by Doppler ultrasound at baseline and during the postprandial clamp with and without GLP‐1 is shown in b and a, respectively. Graphs c and d show acoustic intensity (AI) generated from microvascular microbubble contrast refilling (corresponding to MBV) plotted against time. MBF at baseline and following feeding alone and with GLP‐1 is shown in e and f, respectively. Fold change in MBF from baseline following feeding with and without GLP‐1 is shown in g. *p < 0.05, **p < 0.01. AI, acoustic intensity; MBF, microvascular blood flow; MBV, microvascular blood volume; LBF, leg blood flow. Data presented as mean ± SEM
