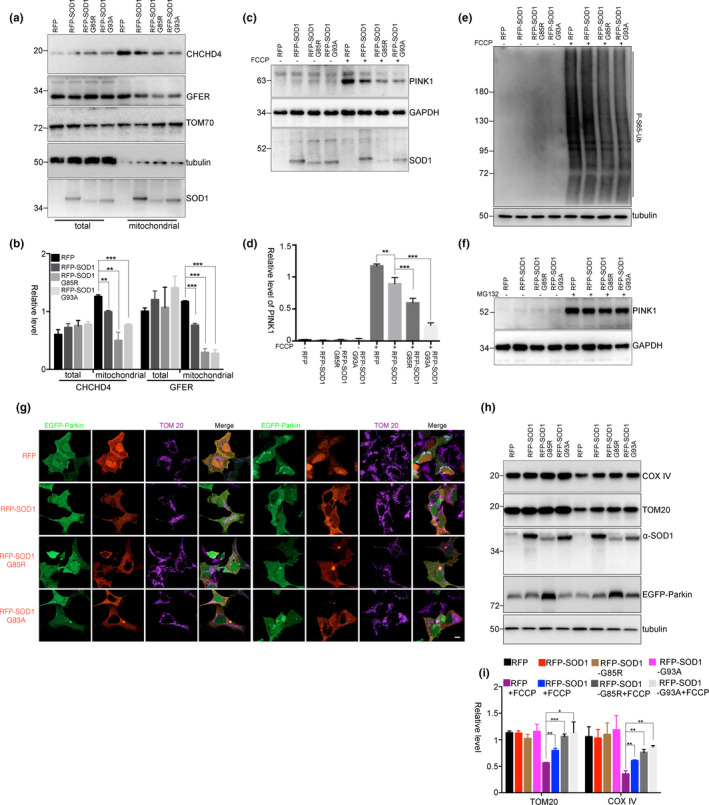
Figure 5.

SOD1 mutants inhibit PINK1 accumulation and mitophagy. (a) and (b) HEK293 cells were transfected with RFP, RFP‐SOD1, RFP‐SOD1 G85R, or RFP‐SOD1 G93A for 48 hr. Then, the mitochondria were isolated for immunoblot analysis. The relative levels of CHCHD4 and GFER to TOM70 from three independent experiments were shown in (b). Mean ± SEM, **p < 0.01, ***p < 0.001 by one‐way ANOVA. (c–f) HEK293 cells were transfected with RFP, RFP‐SOD1, RFP‐SOD1 G85R, or RFP‐SOD1 G93A for 48 hr and treated with FCCP (5 mM) for 3 hr (c–e) or MG132 (10 mM) for 3 hr (f). The endogenous PINK1 (c and f) and phospho‐Ub (Ser65) (e) were detected using immunoblot analyses. The relative levels of PINK1 to GAPDH from three independent experiments were quantified (d). Mean ± SEM, **p < 0.01, ***p < 0.001 by one‐way ANOVA. (g–i) HEK293 cells were co‐transfected with RFP, RFP‐SOD1, RFP‐SOD1 G85R or RFP‐SOD1 G93A and EGFP‐Parkin, followed by treatments with FCCP (5 mM) for 3 hr (g) or FCCP (5 mM) for 24 hr (h) and (i). The relative levels of TOM20 and COX IV to tubulin from three independent experiments were shown in (i). Mean ± SEM, *p < 0.05, **p < 0.01, ***p < 0.001 by one‐way ANOVA. Scale bar, 10 μm
