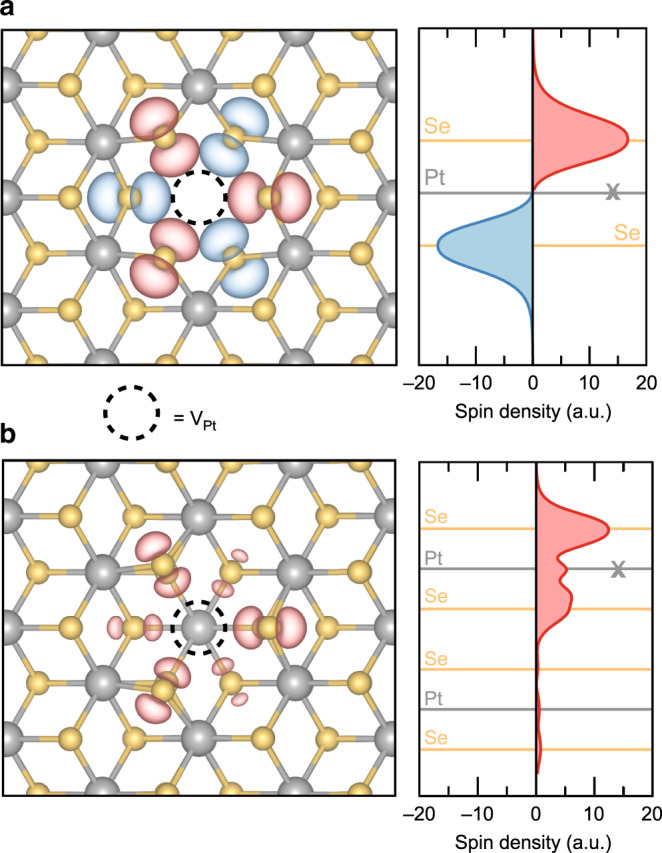
Fig. 4. Localized magnetic moments at Pt vacancy defects in PtSe2.

a Spin-density distribution at the ground-state configuration of the VPt defect in monolayer PtSe2 calculated from first principles. Gray and orange balls represent Pt and Se atoms, respectively. The red and blue isosurfaces correspond to positive and negative spin densities. The position of the missing Pt atom is marked with a dashed circle. The right panel shows the in-plane averaged spin density as a function of the out-of-plane position. The cross (X) indicates the Pt atomic plane at which the vacancy defect is introduced. b Spin-density distribution at the Pt vacancy in the top layer of bilayer PtSe2 calculated from first principles. Units in panels (a) and (b) agree with each other.
