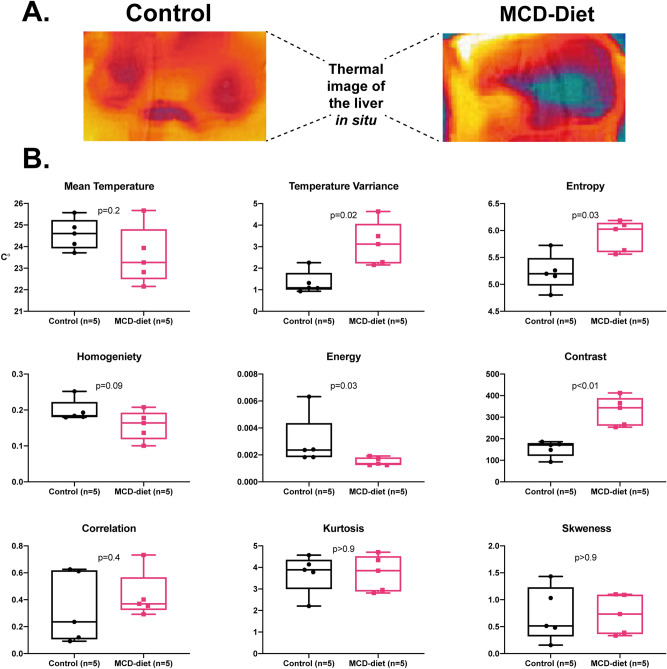
Figure 5.
Thermal imaging of livers in situ. We captured direct thermal images of the livers in situ in live (sedated) mice fed an MCD vs regular diet for 6 weeks. (A) Thermal image of the liver tissue. (B) Presented are multiple texture features extracted from the thermal image by our image processing algorithm. Livers of mice fed an MCD diet demonstrated elevated levels of heterogeneity across the thermal image measured by temperature variance, entropy, and contrast, combined with decreased homogeneity and energy values. Displayed are box-and-whisker plots with individual values. P-values by Mann–Whitney test.

