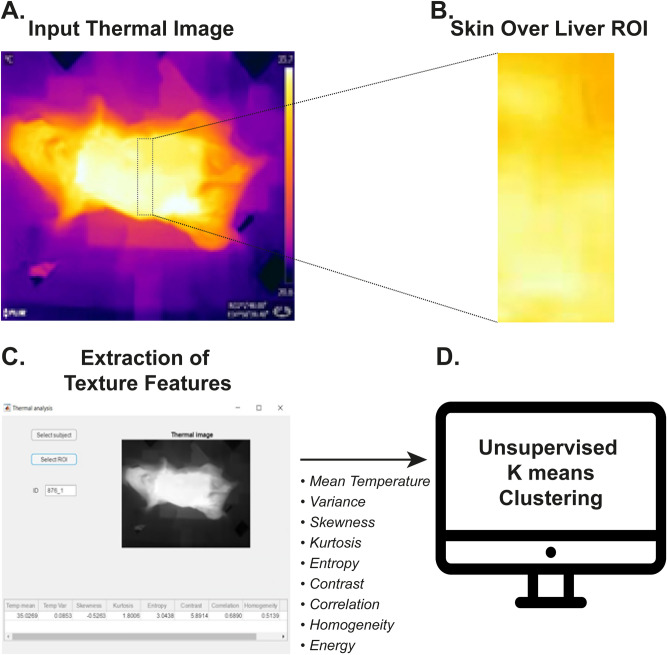
Figure 6.
Non-invasive thermal image processing. (A) Non-invasive thermal images (IRON scale) of the mice were captured weekly. (B, C) Thermal images were processed by our algorithm which extracts multiple features from the selected region of interest (ROI) covering the liver. Displayed are the ROI (B) and the Graphical User Interface (C) we developed. (D) Output parameters were fed as input into a t-SNE dimensionality reduction algorithm, followed by k-means clustering. t-SNE t-distributed stochastic neighbor embedding.

