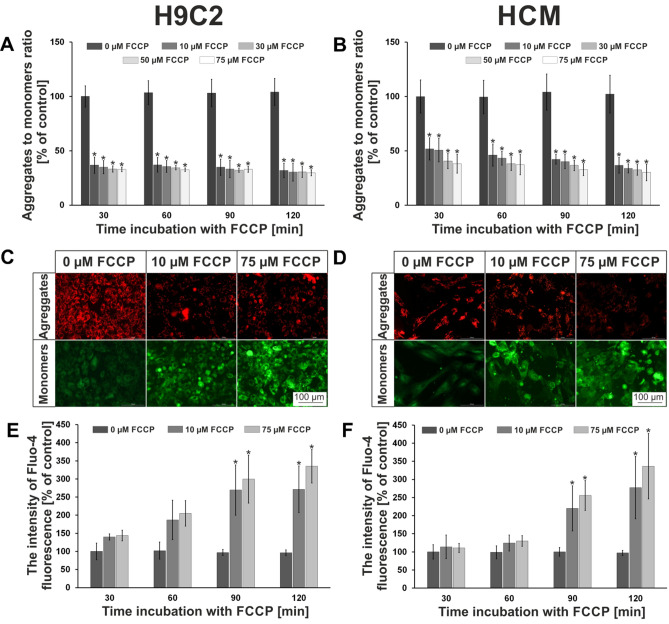
Figure 3.
The macroscale results of hypoxia optimization. The results obtained in tests on changes in mitochondrial membrane potential for (A) H9C2 and (B) HCM cell lines. (C) H9C2 cells and (D) HCM cells after 120 min incubation with FCCP. Both cell lines were stained with JC-1. The results obtained in tests on changes in concentration of intracellular calcium ions for (E) H9C2 and (F) HCM cell lines. N ≥ 3, asterisks indicate p < 0.05.

