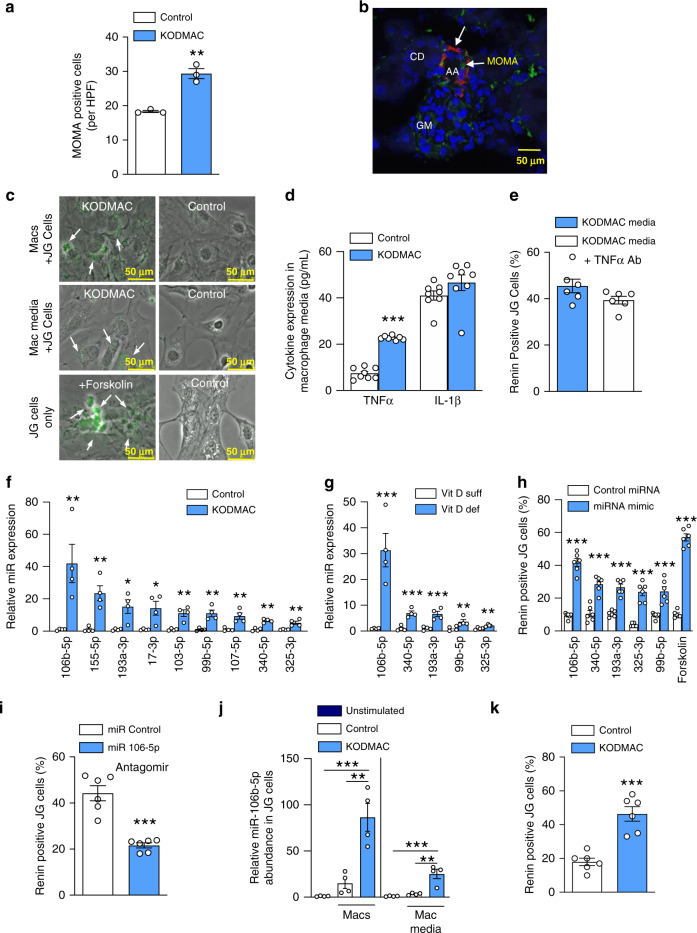
Fig. 2. KODMAC macrophage miR-106b-5p secretion induces JG cell renin production.
a MOMA-positive cells per high-power field (HPF) in the kidney of KODMAC (light-blue bar) or control mice (white bar) (n = 3/group). b Confocal microscopy of JG apparatus in KODMAC mice with staining for renin (red), macrophages (green, MOMA-2), and merge (yellow) showing an afferent artery (AA), collecting duct (CD), and glomerulus (GM) (scale bars: 50 µm) (representative of n = 5). c Renin-positive (YFP-labeled Ren1c) JG cells (renin expression = green) cocultured with KODMAC or control macrophages or their media (forskolin = positive control) (representative of 6/group, scale bars: 50 µm). d Peritoneal macrophage media cytokine secretion from KODMAC or control mice (n = 8/group). e Renin-positive JG cells after culture with KODMAC macrophage media with or without anti-TNFα antibody (n = 6/group). Relative miRNA expression from (f) KODMAC or control peritoneal macrophage media exosomes (n = 4/group) and g vitamin D-deficient or -sufficient peritoneal macrophage media exosomes (n = 4/group). h Renin-positive JG cells after transfection with miRNA mimics (n = 6/group). i Renin-positive JG cells after transfection with miR-106b-5p antagomir or miR control and exposed to KODMAC macrophage media (n = 6/group). j miR-106b-5p abundance in JG cells before and after coculture with KODMAC or control peritoneal macrophages or their media (n = 4/group). k Renin positivity in JG cells transfected with pre-miR-106b siRNA, then cocultured with KODMAC or control macrophage media (n = 6/group). Data expressed as mean ± SEM from (a–h, i, k) Student’s two-tailed unpaired t test with **P < 0.01, ***P < 0.001 vs. control or vitamin D-sufficient and j one-way ANOVA with Tukey’s post hoc test with **P < 0.01, ***P < 0.001.

