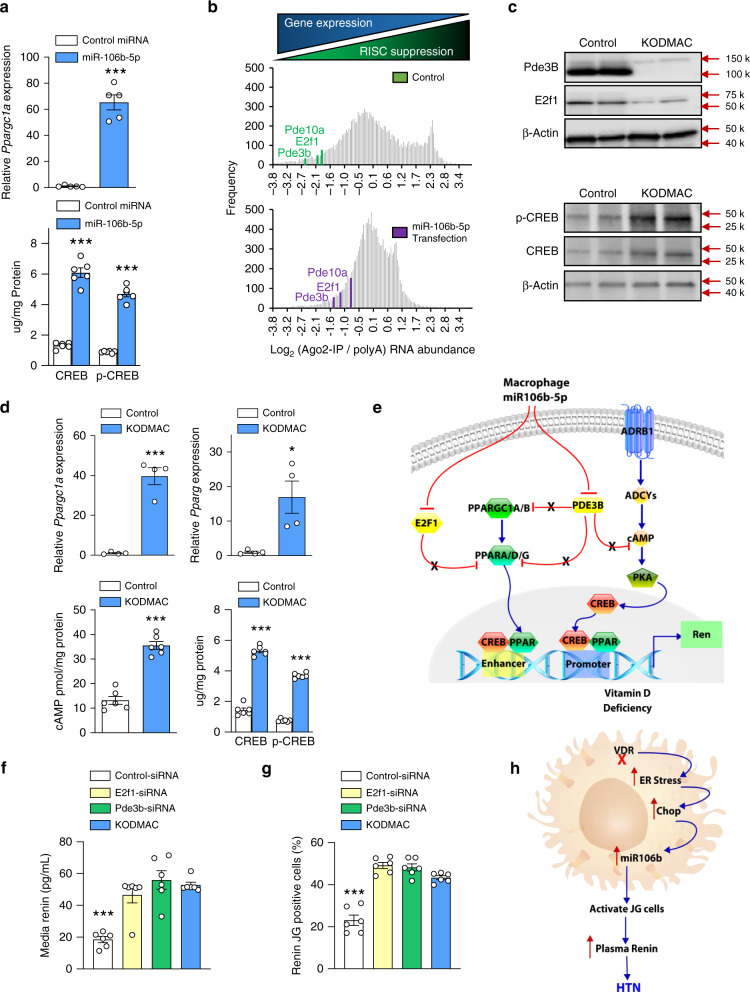
Fig. 4. Enhancement of renin transcription by miR-106b-5p modulation of PPAR and CREB signaling.
a Pppargc1a mRNA expression and CREB (n = 5/group) and phospho-CREB protein abundance in miR-106b- (light-blue bar), or control- (white bar) transfected JG cells (n = 6/group). b Histogram displaying frequencies of log2 Ago2-IP vs. global polyA(RNA) abundance ratio for all detected mRNAs (gray bars) with positions of selected PPAR and CREB signaling mediators under control (green) and miR-106b-transfected (purple) conditions. c E2f1, Pde3b, CREB, and phospho-CREB protein expression in JG cells exposed to control (white bar) or KODMAC media (light-blue bar) (representative of 4/group). d Pppargc1a and Pparg mRNA expression (n = 4/group), and cAMP and CREB protein abundance in JG cells after culture with KODMAC or control peritoneal macrophage media (n = 6/group). e Schematic diagram of relevant cell signaling pathways. Macrophage miR-106b-5p inhibits JG cell E2f1 and Pde3b, removing inhibition of PCG1 and CREB pathways to induce renin production. Blue arrows represent stimulatory pathways and red lines represent inhibitory pathways, while X represents repressed inhibition. f Renin-positive (YFP-labeled Ren1c) JG cells and g renin secretion after transfection with siRNAs against E2f1 (yellow bar) or Pde3b (green bar) or coculture with KODMAC macrophage media (light-blue bar) (n = 6/group). h Mechanistic schematic diagram. Data expressed as mean ± SEM from (a, d) Student’s two-tailed unpaired t test with *P < 0.05, ***P < 0.001 vs. control and (f, g) one-way ANOVA with Tukey’s post hoc test with **P < 0.001 vs. all.

