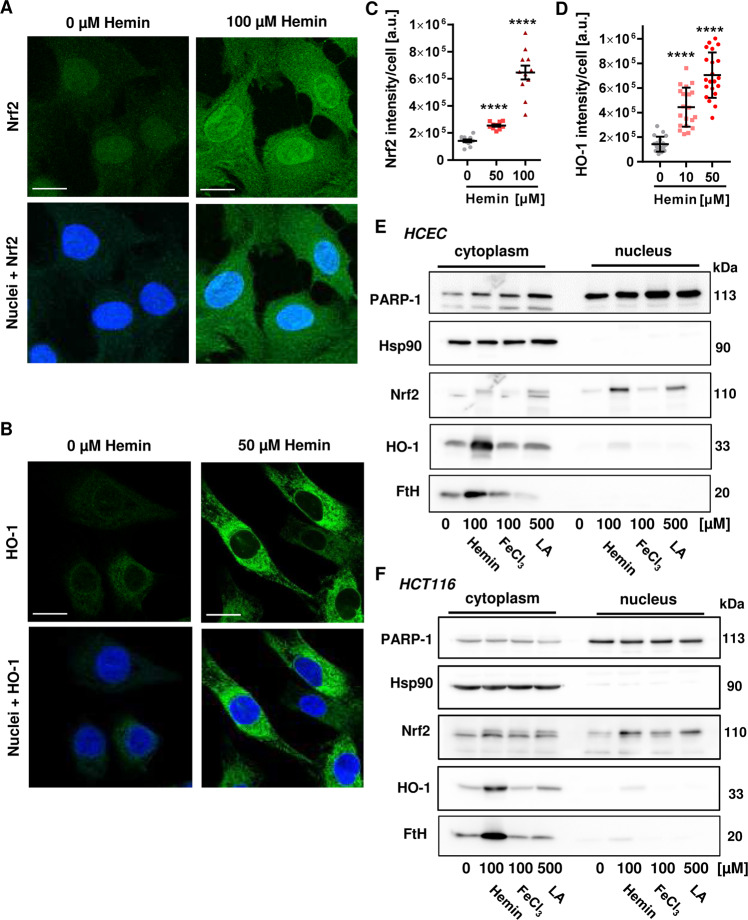
Fig. 4. Impact of hemin and inorganic iron on Nrf2 signaling in HCEC and CRC cells.
a HCEC were exposed to hemin (0–100 µM) for 2 h. Cells were fixed, processed for Nrf2 staining and analyzed by confocal microscopy. Representative images are shown. Nrf2 is depicted in green and nuclei are shown in blue. Scale bar: 20 µm. b HCEC were treated with hemin (0–50 µM) for 8 h. Cells were fixed, processed for HO-1 staining and analyzed by confocal microscopy. Representative images are shown. HO-1 is depicted in green and nuclei are shown in blue. Scale bar: 20 µm. c Quantitative evaluation of Nrf2 staining shown in a. Nrf2 intensity was quantified by ImageJ. Data are given as mean + SEM (n = 2). ****p < 0.0001. d Quantitative evaluation of HO-1 staining shown in b. HO-1 intensity was quantified by ImageJ and data are indicated as mean + SEM (n = 3). ****p < 0.0001. e HCEC were incubated for 8 h with 100 µM hemin, 100 µM FeCl3, or 500 µM α-Lipoic acid (LA). Cell fractionation was performed as described. Cytoplasmic and nuclear protein extracts were then analyzed by SDS-PAGE and western blot detection of Nrf2, HO-1 and FtH. PARP-1 served as nuclear loading control, while Hsp90 was used as cytoplasmic loading control. f HCT116 were treated, processed and analyzed as stated under e.

