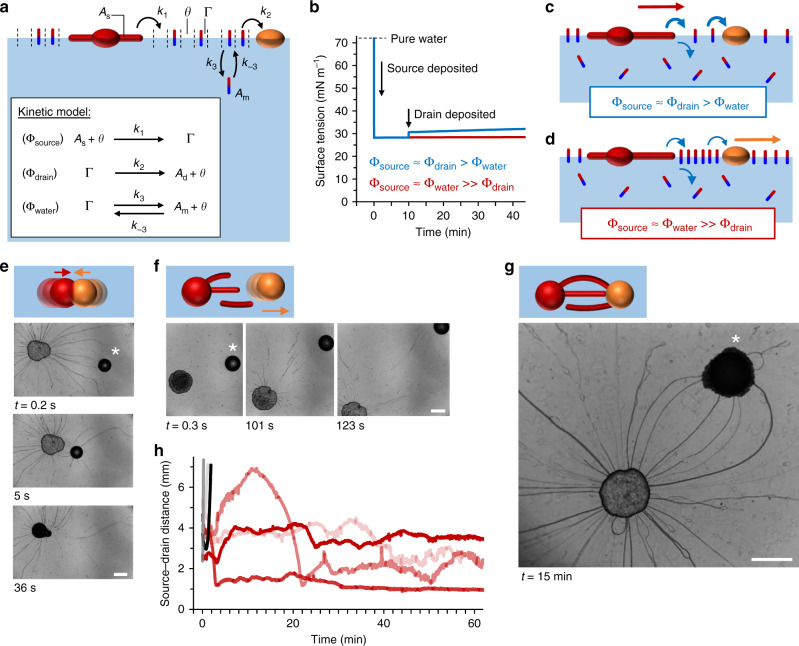
Fig. 2. Droplet positioning relies on balanced rates of amphiphile release, depletion, and filament absorption.
a Kinetic model, describing Φsource, the release of amphiphiles from the source droplet (red sphere) to the air–water interface; Φdrain, the depletion of amphiphiles from the air–water interface to the drain droplet (orange sphere), and Φwater, the depletion of amphiphiles from the air–water interface to the underlying aqueous phase (blue). b Simulations of surface tension kinetics upon deposition of the source and drain droplets. The surface tension increases only if the uptake of amphiphiles at the drain is faster than the depletion towards the underlying aqueous phase (blue curve). c If Φsource ≈ Φdrain > Φwater, the Marangoni flow is dominated by depletion at the drain. d If Φsource ≈ Φwater ≫ Φdrain, the Marangoni flow is dominated by depletion towards the underlying aqueous phase. e In the drain-dominated regime 1, a strong Marangoni flow emerged from the source droplet towards the drain (deposited at t = 0 s, indicated with an asterisk), and the drain merged with the source droplet. f In regime 2, the Marangoni flow was dominated by depletion towards the underlying aqueous phase and pushed the drain (deposited at t = 0 s) away from the source (deposited at t = −34.5 s). g In regime 3, the filaments were absorbed by the drain droplet, such that the drain was kept in position—despite the repulsive forces of the Marangoni flow. h Time-dependent center-to-center source–drain distance: the black and gray curves correspond to the experiments shown in f and Supplementary Fig. 5; the red curves to the experiments shown in g and Supplementary Fig. 6. The scale bars represent 1 mm.

