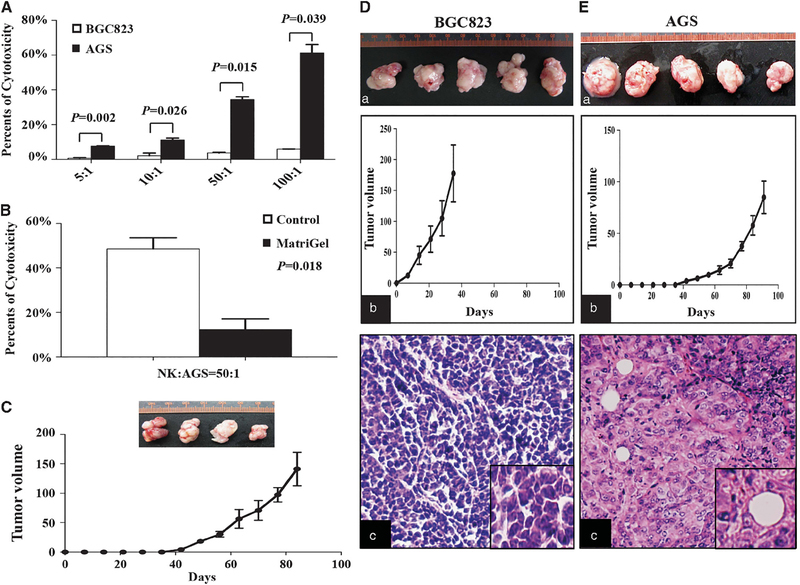
Figure 1.
Cytotoxicity of NK cells towards BGC823 and AGS cells. (A) NK cell cytotoxicity assays for BGC823 and AGS cells treated with different numbers of NK cells. Data are means±s.d. (B) Cytotoxicity assays of AGS cells coated with or without Matrigel. Data are means ±s.d. (C) Tumors of AGS cells coated with Matrigel in nude mice (upper) and tumor growth curves (lower). (D and E) Tumorigenicity of BGC823 (D) and AGS cells (E) in NOD-SCID mice. (a) The photograph of tumors. (b) Tumor growth curves. (c) HE staining of xenograft tumor tissues.

