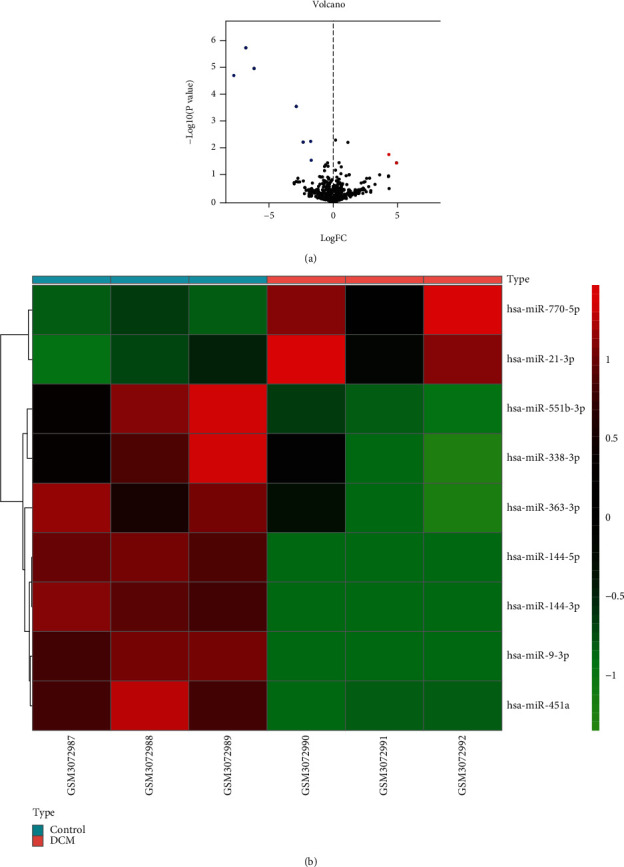
Figure 1.

Volcano map of DEMis. Red spots represent upregulated genes; green spots represent downregulated genes (a). Heat map of DEMis. The left three samples were from the control group, and the right three samples were from the DCM group. Red color: high expression; blue color: low expression (b).
