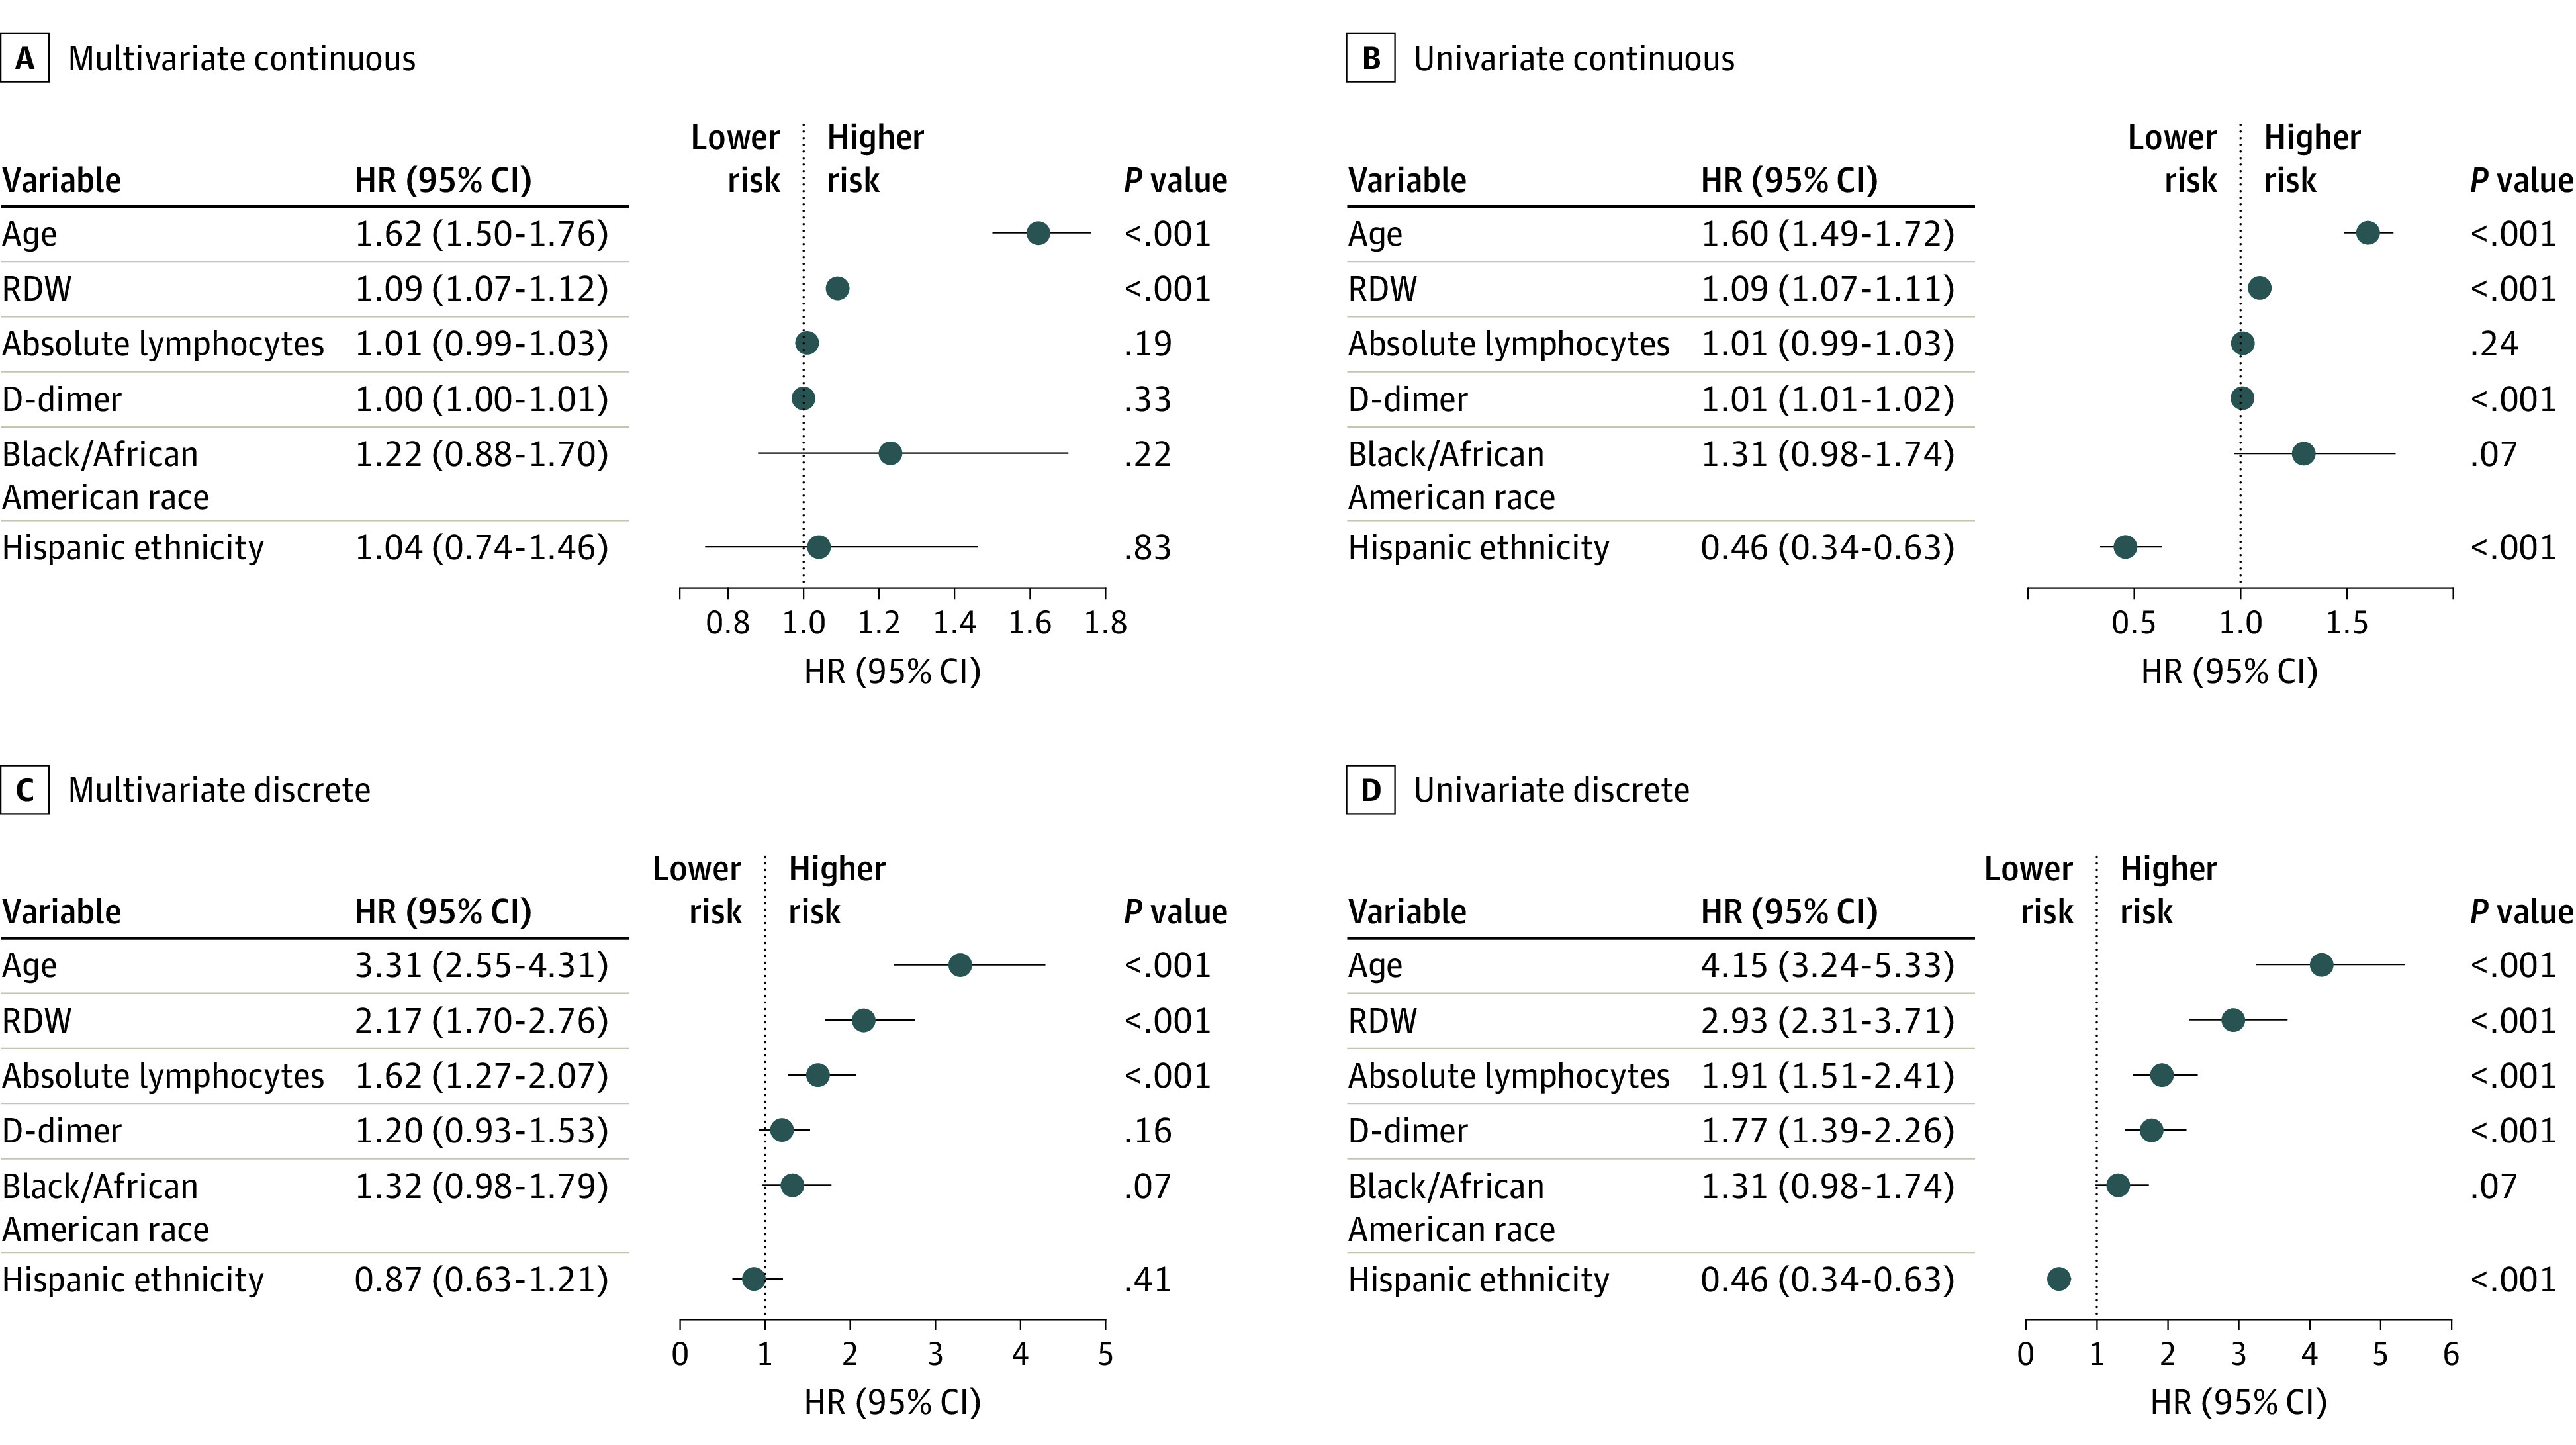
Figure 2. Cox Proportional Hazards Modeling of Mortality Risk .

Models of mortality adjusted for age, race, ethnicity, red blood cell distribution width (RDW), absolute lymphocyte count, and D-dimer (dimerized plasmin fragment D) level are given for the multivariate (A) and univariate (B) analyses. Variables were coded as either continuous (A and B) or discrete (C and D) using the following thresholds: age older than 70 years, RDW >14.5%, lymphocyte count <0.8 × 10⁹/L, and D-dimer level greater than 1500 ng/L, which provided similar proportions of abnormality in the cohort (33%, 29%, 27%, and 28%, respectively, for age, RDW, lymphocyte count, and D-dimer level). Race was coded as 1 for Black/African American, and 0 for all other groups. Ethnicity was coded as 1 for Hispanic, and 0 for non-Hispanic/unknown. For continuous models, changes in variables were normalized as follows: age increase of 10 years, RDW increase of 0.5%, D-dimer level increase of 100 ng/L, and a lymphocyte count decrease of 0.1 103 ×109/L.
