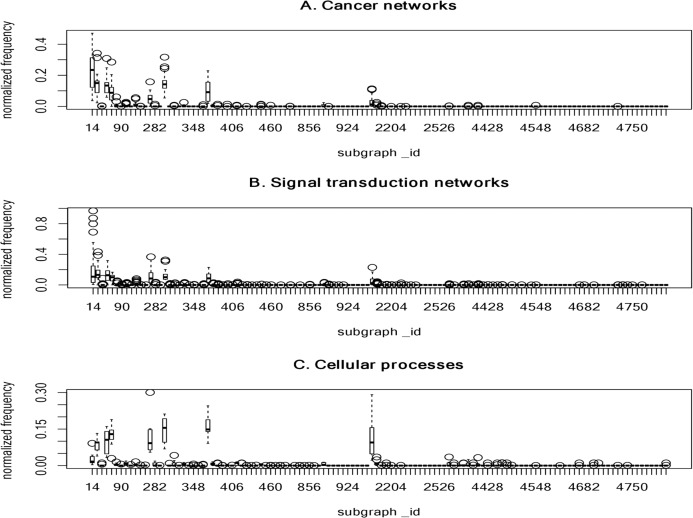
Figure 3. The plots of the normalized frequency of the 4-node subgraphs for (A) the cancer networks, (B) the signal transduction networks and (C) the cellular processes.
Only the first 120 subgraphs’ normalized frequency are shown, the rest of the subgraphs have zero normalized frequency. Eight subgraphs (id_14, id_28, id_74, id_76, id_280, id_328, id_392, and id_2184) dominate the three molecular network classes. These results indicate that molecular networks are composed of a finite number of subgraph patterns.

