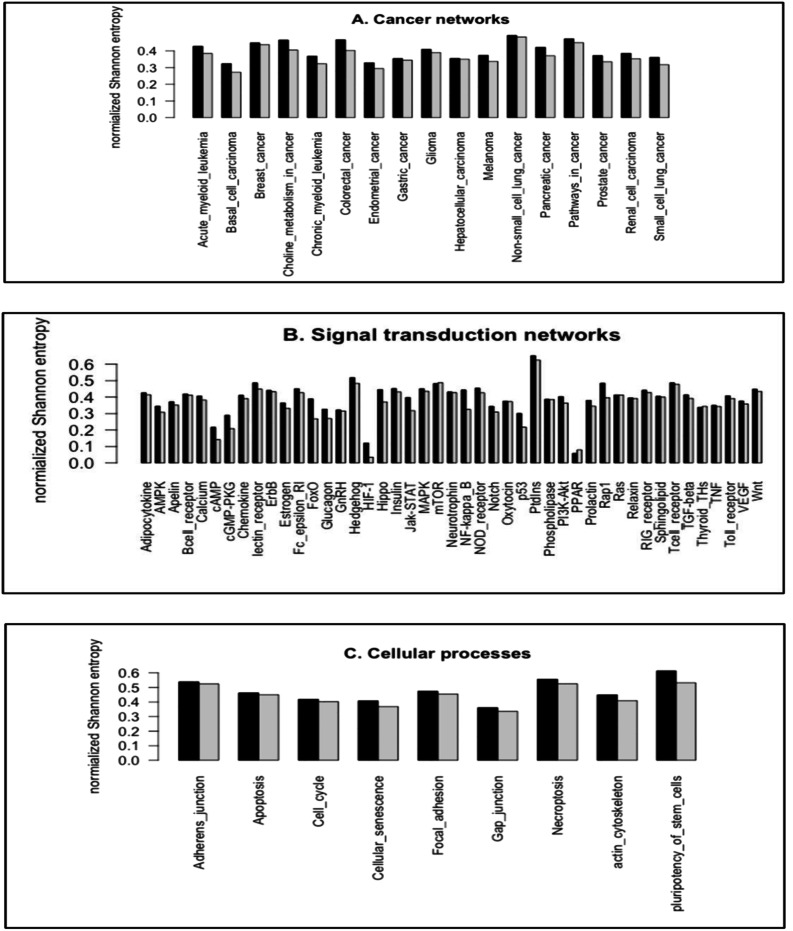
Figure 4. The plots of the normalized Shannon entropy for the 3-node subgraphs (black, H3R) and the 4-node subgraphs (grey, H4R), where (A) the cancer networks, (B) the signal transduction networks, and (C) the cellular processes.
The normalized frequency distributions are not uniformly distributed among the subgraph patterns. Therefore, H3R and H4R are different from zero and one.

