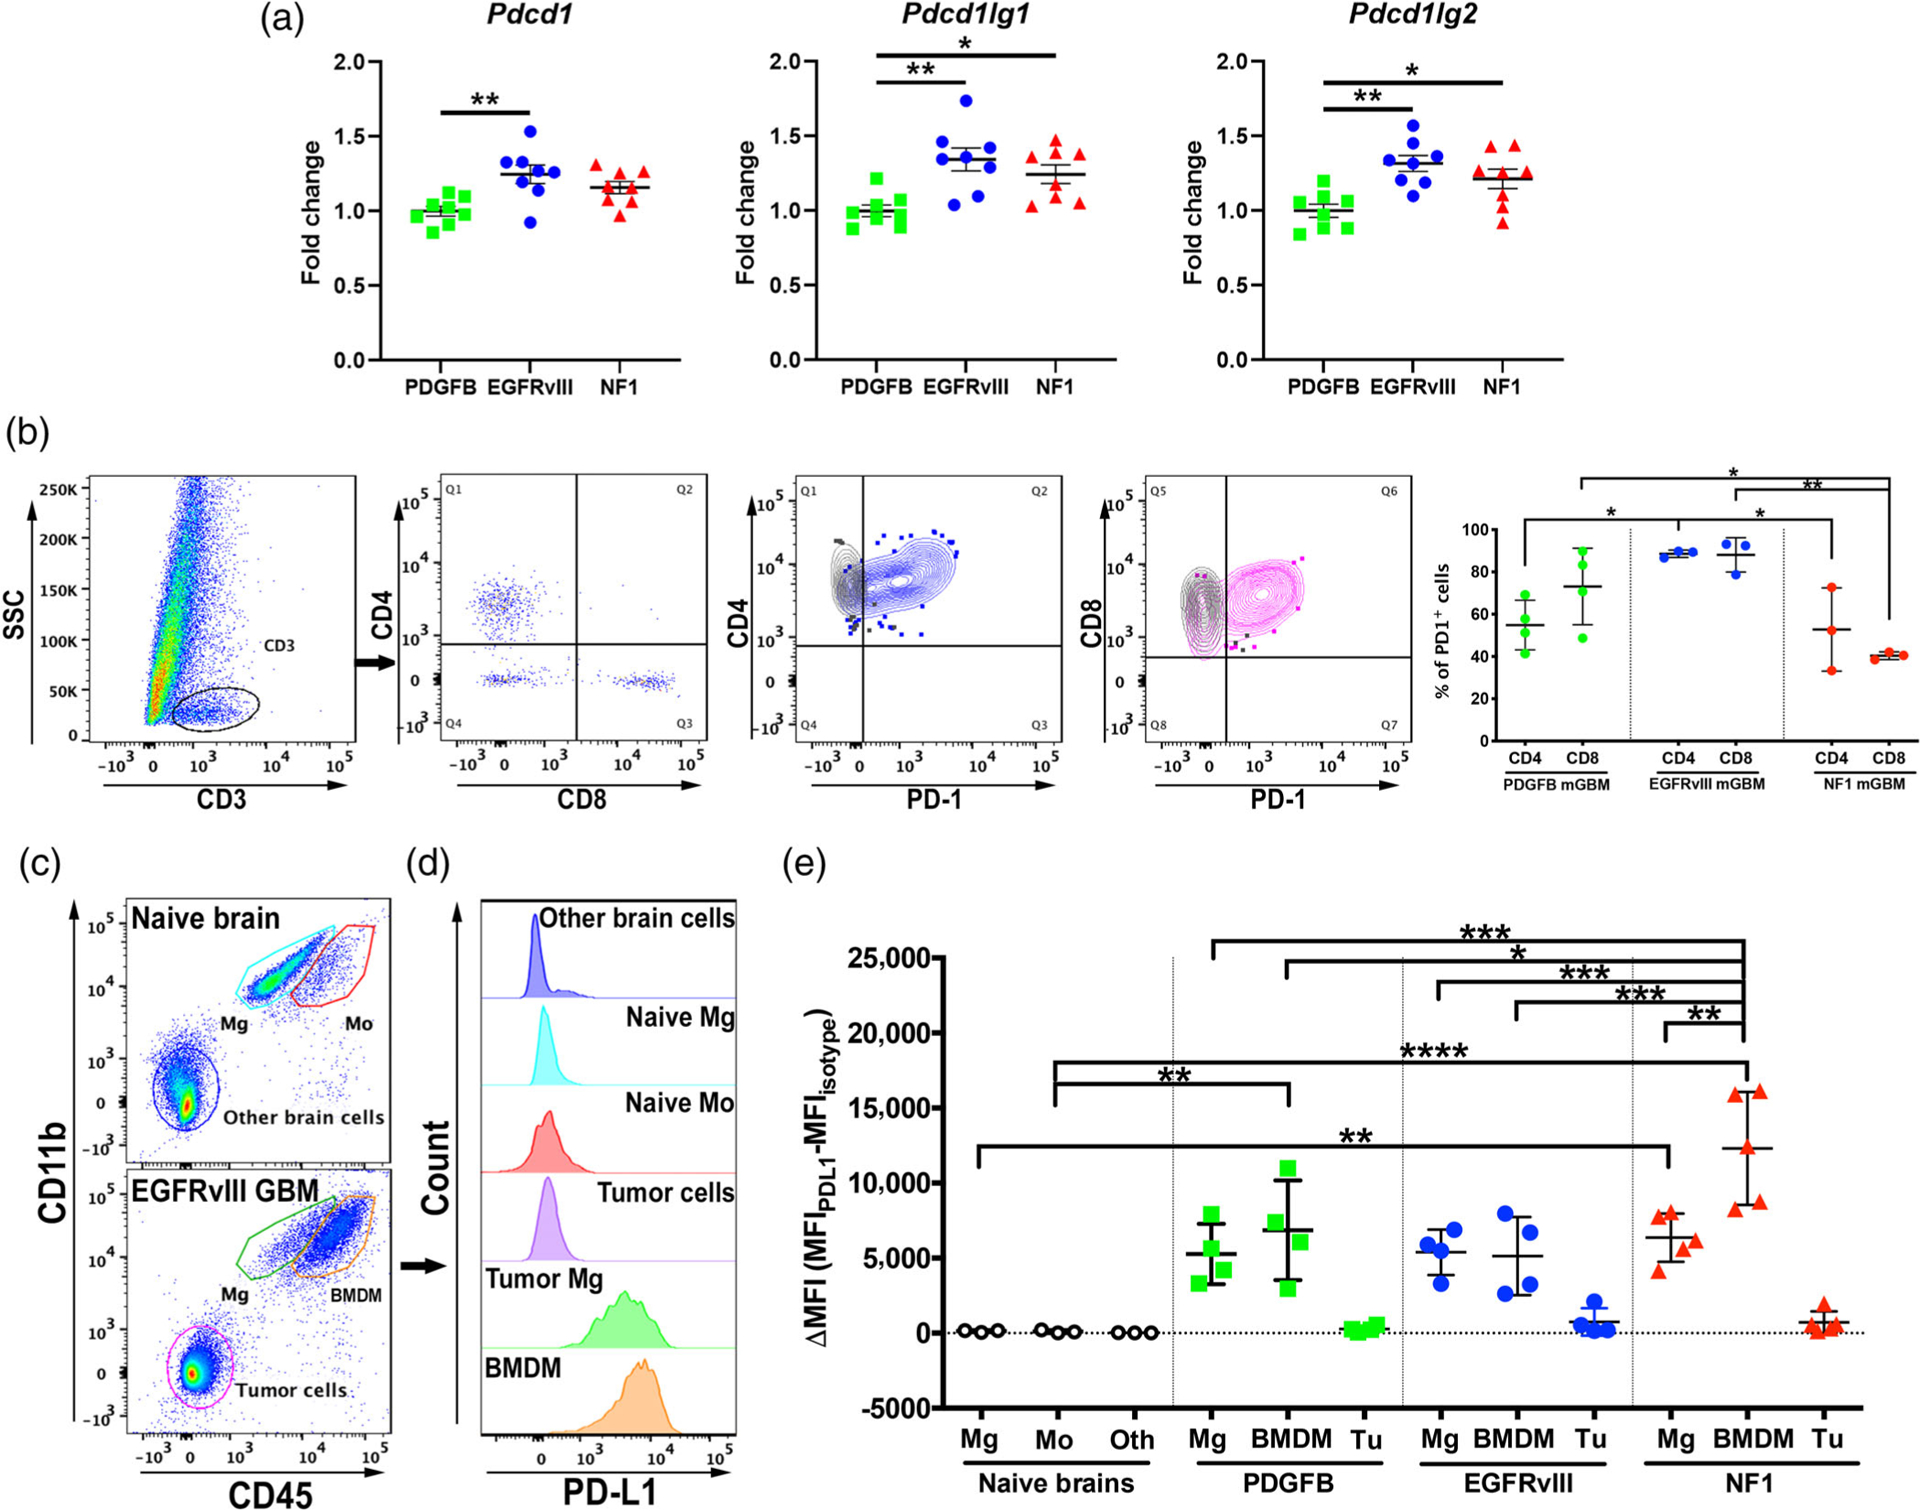
FIGURE 5.

PD-L1 expression is elevated the most in tumor-associated BMDM. (a) Transcription of PD-1 and its ligands are elevated in EGFRvIII mGBM compared to other subtypes. (b) Flow cytometry analysis of PD-1 expression in tumor infiltrating lymphocytes. (c) Gating strategy as represented by CD45 and CD11b (other parameters not shown). Microglia (Mg, CD45LoCD11b+), bone marrow-derived myeloid cells (Mo, CD45HiCD11b+), non-myeloid cells in normal brain, and tumor cells (CD45−CD11b−) are identified in naïve or GBM brain tissues by FACS. (d) Representative off-set overlay histogram of PD-L1 expression in each cell type. (e) Quantification of mean fluorescent intensity (MFI) of PD-L1 compared to isotype control. Mg, microglia. Mo, monocytes. Oth, other normal brain cells. BMDM: bone marrow-derived macrophages. Tu: tumor cells. *p < .05, **p < .01, ***p < .001, by one-way ANOVA with Tukey’s posthoc test
