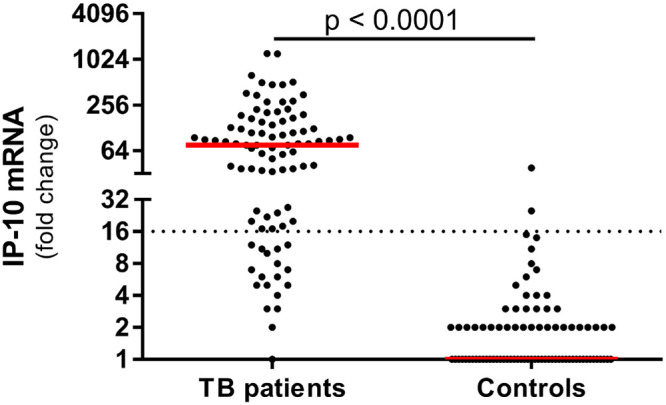
FIG 2.

IP-10 mRNA expression in TB patients and healthy controls. Whole-blood samples from 89 TB patients and 99 healthy controls were stimulated for 8 h in QFT tubes, and total RNA was extracted. IP-10 mRNA expression was evaluated using our in-house RT-qPCR. Dotted line represents calculated cutoff (16-fold change). Median values are indicated in red. Statistical analysis was done using the Mann-Whitney test.
