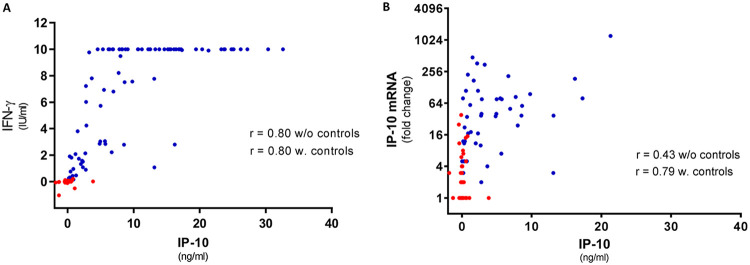
FIG 3.
Correlation analysis between IFN-γ and IP-10 proteins and IP-10 protein and its mRNA. (A) Correlation between plasma IFN-γ and IP-10 protein levels. Data for TB patients and healthy controls are plotted together (n = 146). Due to the maximum limit of 10 IU/ml in the IFN-γ ELISA, all samples at this level (n = 42) have been omitted from the analysis; however, they are not omitted from the graph. (B) Correlation between plasma IP-10 protein and mRNA expression. Data for TB patients and healthy controls are plotted together (n = 188). Red dots represent healthy controls, and blue dots TB patients. Spearman correlation analysis was performed with and without data for healthy controls to disclose any bias due to the healthy control samples.

