
FIG 5.
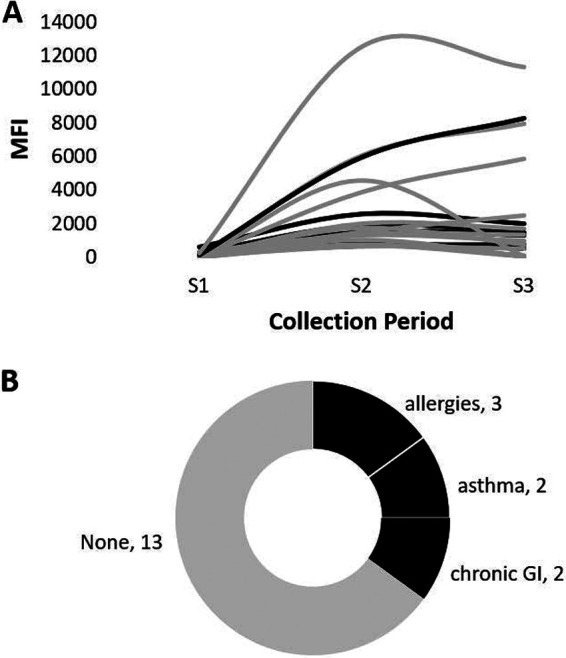
Summary of HAV immunoconversions and reported chronic underlying conditions (CUCs). (A) MFI response curves of the 20 individuals who immunoconverted. (B) Tree map of CUCs reported for individuals with HAV immunoconversions. The line color/shading is used to denote individuals with (black) and without (gray) CUCs.