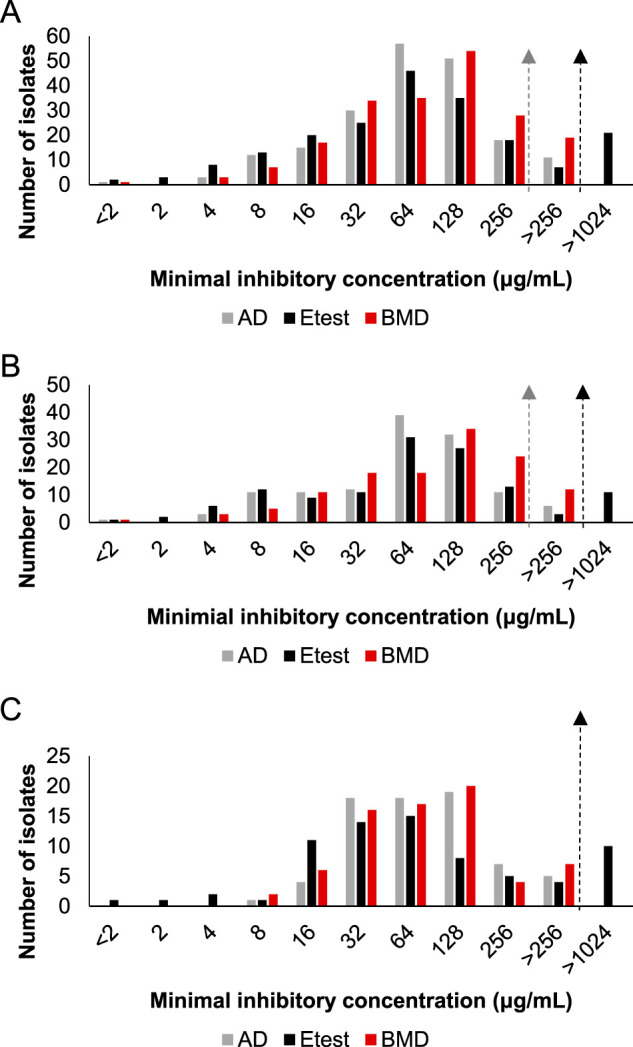
FIG 1.

Bar graph depictions of MIC distribution by AD (gray bars), Etest (black bars), and BMD (red bars) across collections. The dashed lines with arrows indicate calculated ECVs by AD (gray line) or BMD (black line). (A) Combined collection (n = 198) with an AD ECV of 256 μg/ml and BMD ECV of 512 μg/ml. (B) U.S. collection (n = 126) with an AD ECV of 256 μg/ml and BMD ECV of 512 μg/ml. (C) Australian collection (n = 72) with AD and BMD ECVs both of 512 μg/ml. Etest values of 512 μg/ml or 1,024 μg/ml are denoted as >256 μg/ml, and those with values of >1,024 μg/ml are noted as such.
