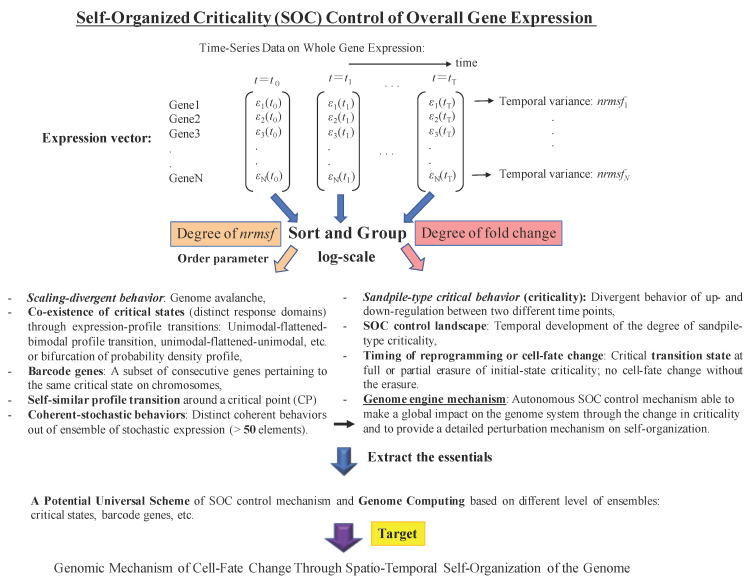
Figure 1.
Glossary and strategy of analysis: An extremely schematic view of the data analysis strategy (top) used to reveal SOC gene-expression regulation together with a glossary of the principal features of self-organization behavior highlighted by previous analyses in several biological processes (bottom); scaling divergent behavior (e.g., Figure 1A in [1]; Figure 5F in [2]; Figure 4 in [3]; Figure 1A in [4]); co-existence of critical states (Figures 4, 5 and 8 in [1]; Figures 1 and 2C in [2]; Figure 9 in [3]; Figure 3A in [4]); barcode genes (Figures 8 and 9 in [2]); self-similar profile transitions (Figure 3 in [2]; Figure 6 in [3]); coherent-stochastic behaviors (Figures 7 and 9 in [1]; Figures 5A and 6 in [2]; Figures 10 and 11 in [3]; Figure 3 in [4]); sandpile-type criticality (Figure 2D in [2]; Figures 3A and 4 in [3]); SOC control landscape (Figure 8 in [3]; Figure 2 in [4]); timing of reprogramming (Figures 5, 7B–D and S1 in [3]; Figure 2 in [4]); genome engine mechanisms (Figures 12 and 13 and the Discussion in [3]; Figures 5–7 in [4]).

