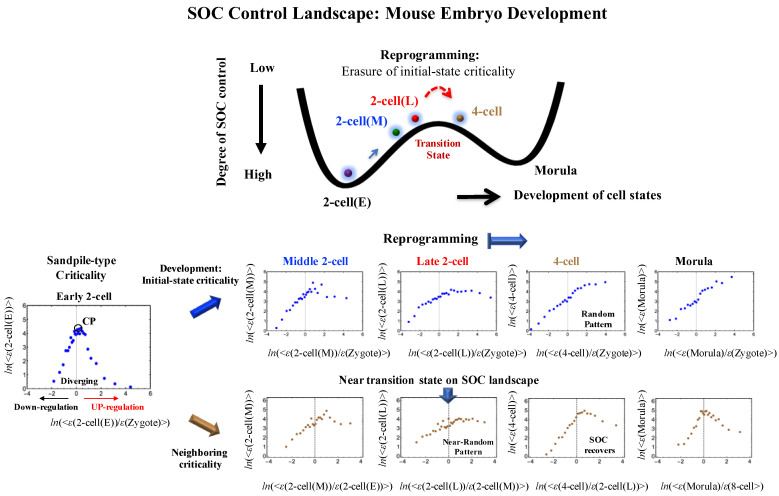
Figure 4.
Timing of the genome-state change on the SOC control landscape in a single cell: A change in critical dynamics through sandpile-type criticality (diverging up- and down-regulation at the CP around ln(<nrmsf>) ~ −5.5), which affects the entire genome-expression dynamics (see details in [4]), appears in the change in overall expression (e.g., fold-change) between different time points. Thus, the erasure of sandpile-type criticality in the zygote state points to the timing of a genome-state change in mouse embryo development. This erasure of zygote criticality (upper row: development of initial-state criticality) occurs after the late 2-cell state to reveal a stochastic expression pattern as a linear correlative behavior (refer to [3]). The near-transition point (see a schematic picture of the SOC landscape: top panel) occurs at the middle-late 2-cell states (lower row: development of neighboring criticality), at which sandpile-type criticality disappears and thereafter recovers. Plots reveal the existence of an SOC control landscape and a transition state at around the middle-later 2-cell states. The x- and y-axes represent the fold-change in expression and the group average expression. A detailed mechanism of how reprogramming occurs via the interaction of distinct coherent expression states is given in [4], where the collective behavior of stochastic low-variance RNA expression as a generator of autonomous SOC control guides the reprogramming of mouse embryo development.

