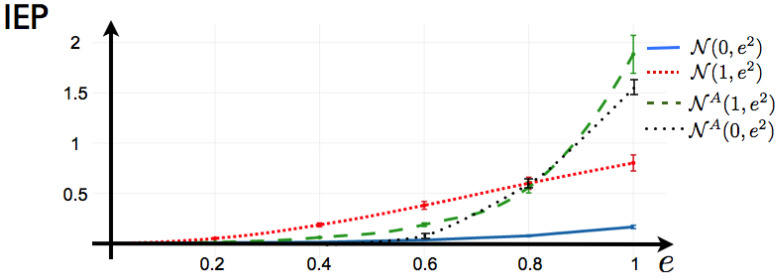
Figure 6.
IEP for the 1-time step Markov potential. The parameters and are draw at random one time and remain fixed. We draw at random the components of 100 matrices from a Gaussian distribution with different values of mean and standard deviation e. We plot the average value of IEP for each case, with the respective error bars.

